
The cryptocurrency markets are staying in consolidative mode after an explosive price action at the week’s start. Stellar (XLM) is extending its sideways trade pattern after attaining highs of $0.3669 on Oct. 7. At the time of writing, XLM was exchanging hands at $0.35, up 7.25% in the last 24 hours and 26.38% weekly as bulls hold grip. MoneyGram International has partnered with the Stellar Development Foundation to enable consumers to send money using USD Coin (USDC) and convert directly to and from fiat. For the past few months, there’s been growing excitement about the Stellar Protocol 18 release, which enables the creation of Automated Market Makers (AMMs) on Stellar. In a recent announcement, the Public network upgrade vote where validators will vote on whether to upgrade the Stellar network to Protocol 18 is scheduled for November 3, 2021, 1500 UTC. Ahead of this, comes a list of software upgrades with the Horizon v2.9.0 release on October 7.
Key Levels
Resistance Levels: $0.4250, $0.4000, $0.3804
Support levels: $0.2967, $0.2550, $0.2000
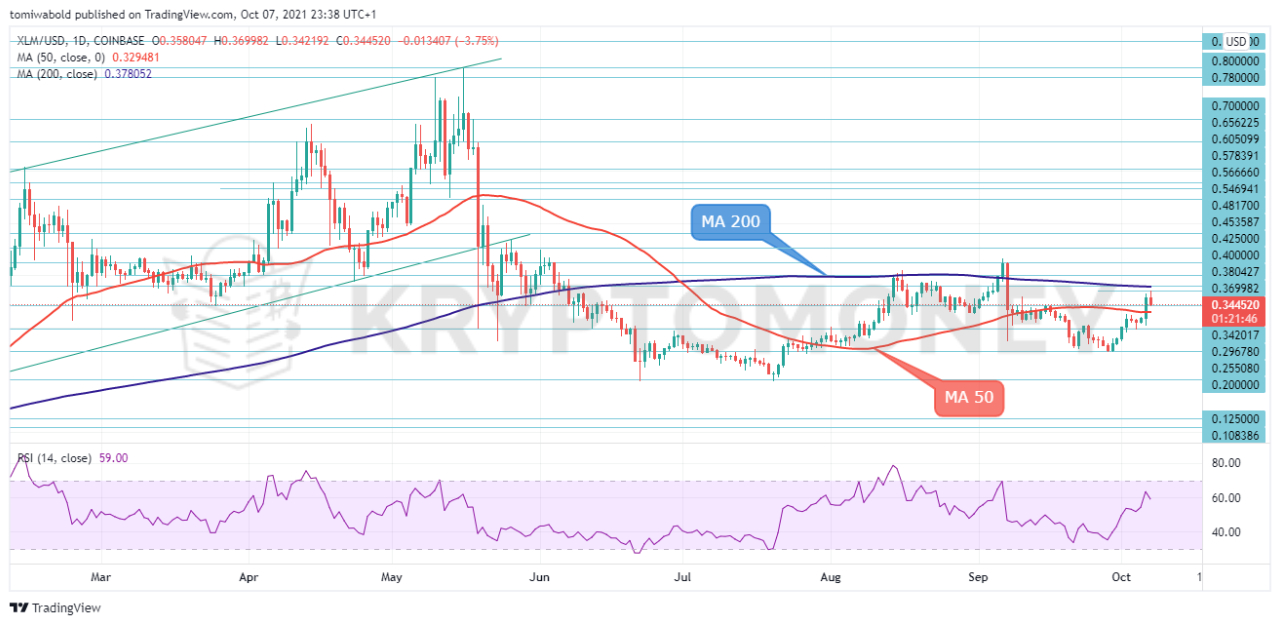 XLM/USD Daily Chart
Stellar is still in the process of breaking above the MA 200 at $0.3780 where it has confirmed resistance since early June. That said, the XLM/USD pair remained range-bound shortly after it ticked yearly highs at $0.797. The guiding and constricting MA 50 and 200 back the suspended picture. On the upside, the MA 200 at $0.3780 remains a restrictive level and unless it gives way, the sideways picture could persist although with downside risks.
A decline beneath the current level could open the door for the retest of the MA 50 at $0.329 ahead of the $0.272-$0.296 support zone. Nevertheless, if the bulls win the battle with the MA 200, the price could accelerate towards the $0.43 –$0.53 congested area. Beyond here, the $0.70 level may pose another challenge to the bulls.
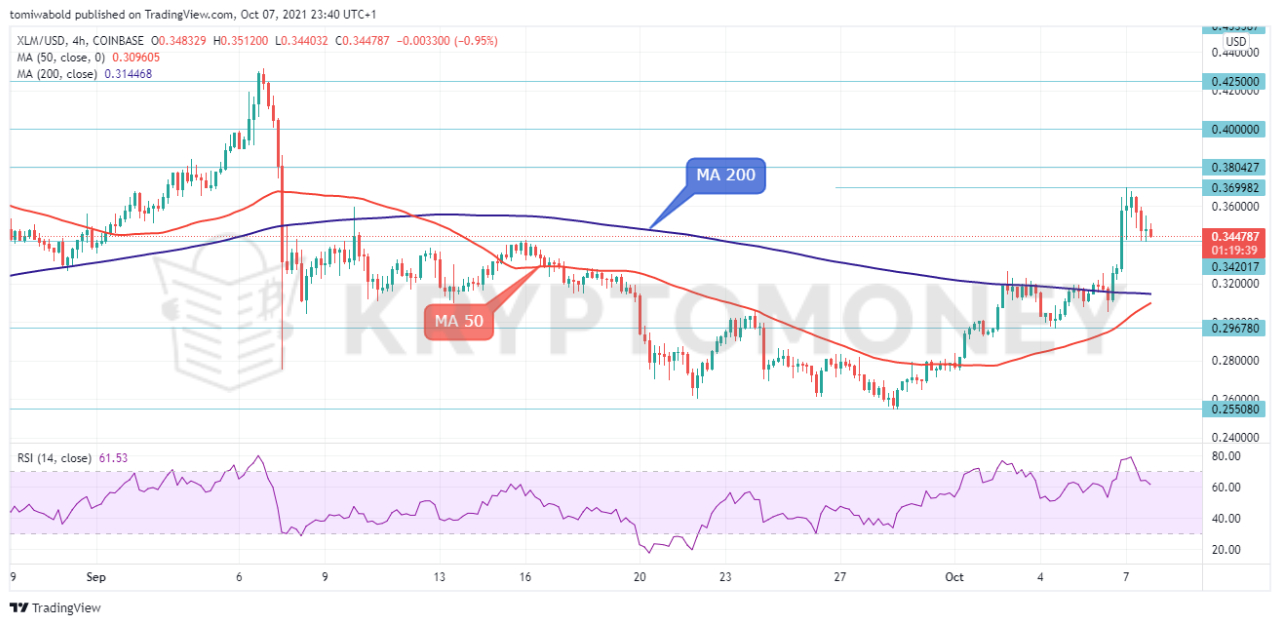 XLM/USD 4-Hour Chart
Stellar started a positive move from the $0.255 level on Sept.28.The rally gained momentum after it broke above the moving averages to reach highs of $0.3699 on Oct. 7. The MA 200 has flattened and stands ready to cross the MA 50. The RSI is presently hovering below the 70-level suggesting a bullish demeanor. The ability to hold above the MA 200 at $0.3144 would signal extended consolidation and keep the immediate focus on the upside.
A break above the $0.3699 high could see XLM price rally towards the $0.45 level ahead of the $0.60 level. On the contrary, break and close below the MA 200 is needed to signal pullback and open the way for further corrective action. Sliding below this boundary, Stellar could meet the MA 50 at $0.309 before challenging the $0.28 level. To summarize, the lengthy range trading raises the odds for an upturn. However, a decisive close above the daily MA 200 ($0.378) is required for a new bullish wave to start.
Note: Kryptomoney.com is not a financial advisor. Do your research before investing your funds in any financial asset or presented product or event. We are not responsible for your investing results
Image Credit: Shutterstock


Keep in mind that we may receive commissions when you click our links and make purchases. However, this does not impact our reviews and comparisons. We try our best to keep things fair and balanced, in order to help you make the best choice for you.