The cryptocurrency market is presently in the red, although BTC remains above $23,000. After reaching a peak of $0.2090, XLM price has been in freefall since Dec.17. XLM breached below the critical support at $0.12 affected by the increased bearish sentiments on the market, especially the SEC lawsuit against Ripple. Stellar (XLM), originally a fork of the Ripple protocol, has been noted to follow XRP on a macro scale, rising and falling simultaneously. When XRP price lost 50% of its value, XLM also got hit quite hard, losing 30% of its value within 24 hours. XLM is on its road to recovery as Stellar investors’ waive off potential SEC lawsuit. XLM is presently trading at $0.1544, up from lows of $0.11 gaining 21.10% on the day. Dip buying continues on XLM/USD to reach intraday highs of $0.1619. Stellar is the 12th largest digital asset with a current market capitalization of $3.3 billion and an average daily trading volume of $1.6 million. Stellar investors have been worried that it might be considered as a security, following Ripple’s lawsuit. The approval of the New York Department of Financial Services for XLM to be used in Paxos Trust Company and XLM pending approval on PayPal may suggest it’s less likely to be considered a security.
*XLM price has been in freefall since Dec. 17
*XLM is trading at $0.1544, up from lows of $0.11 gaining 21.10% on the day
*XLM pending approval on PayPal may suggest it’s less likely for it to be considered a security
Key Levels
Resistance Levels: $0.2337, $0.2000, $0.1703
Support levels: $0.1500, $0.1350, $0.1100
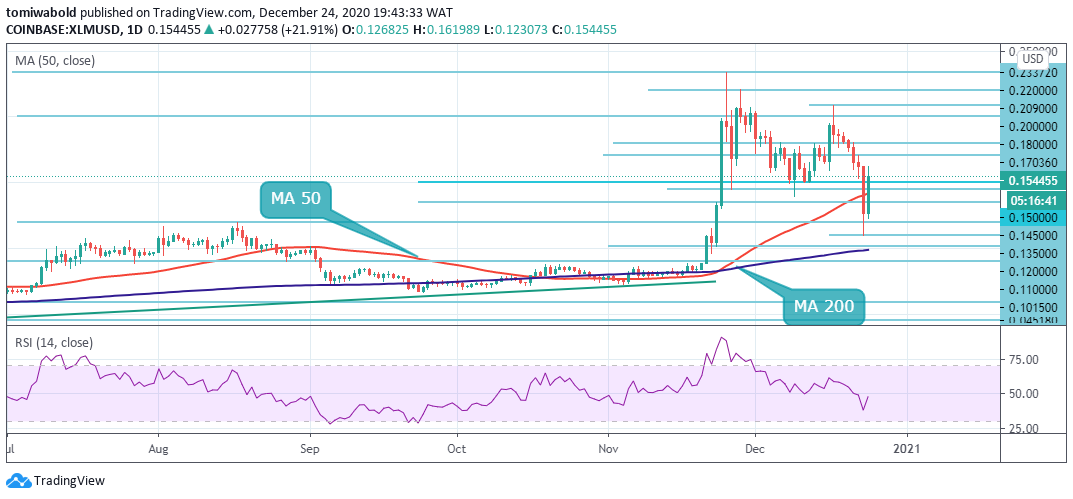 XLM/USD Daily Chart
Stellar (XLM) price plunged below the daily MA 50 support at $0.14 on December 23 to mark lows of $0.11 from where the bulls bought aggressively. On the upside, immediate resistance above where it trades presently is at $0.1703. Barring an extended rally, the first major resistance is seen at $0.2090 while the second one sits at $0.2200.
On the flip side, if the price turns down from its current levels, the XLM/USD pair could dip towards the MA 50 at $0.14. A sustained break below $0.14 could intensify selling pressure and pull XLM price down to $0.12 and then to $0.09.
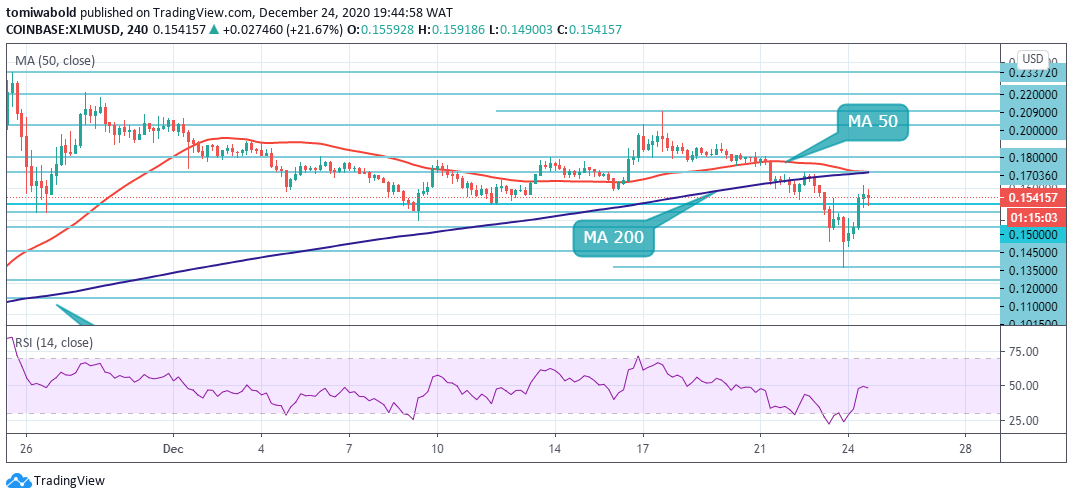 XLM/USD 4-Hour Chart
XLM/USD upside momentum slowed down on its approach to the $0.1619 mark. Once it is cleared, $0.1703 followed by the recent high of $0.2090 will come into focus. The RSI at the midpoint doesn’t give any advantage either to the bulls or bears. XLM is yet to reclaim the 4 hour MA 50 and MA 200 lost on December 22.
Increased selling pressure may cause a retest of the $0.11 support where the recent rebound occurred. A breach beneath $0.11 will reinforce a bearish scenario which may bring the $0.1015 support level to bare. The XLM/USD pair is only bullish while trading above the $0.1703 level, key resistance is found at the $0.18 and the $0.20 levels. If the XLM/USD pair trades below the $0.1500 level, sellers may test the $0.1450 and $0.1350 levels.
Note: Kryptomoney.com is not a financial advisor. Do your research before investing your funds in any financial asset or presented product or event. We are not responsible for your investing results
Image Credit: Shutterstock


Keep in mind that we may receive commissions when you click our links and make purchases. However, this does not impact our reviews and comparisons. We try our best to keep things fair and balanced, in order to help you make the best choice for you.
