The crypto market is a mixed pattern of red and green, BTC plunged beneath $18,000 and Altcoins dived along with it. Stellar (XLM) hit its all-time high of $0.2337 on November 25, since then XLM has been in a downtrend. XLM breakdown persisted till it saw a short relief rally above $0.14 support to $0.2209 high. Since then, XLM remained in a steady decline till a rebound ensued beneath $0.14 on December 9. At the time of this article, XLM/USD is changing hands at $0.1617, up by 5.78 % on the day. Despite the rebound, XLM is still down by 13.51% on a week-to-week basis. Stellar is the 11th largest digital asset with a current market capitalization of $3.45 billion and an average daily trading volume of $722 million. Stellar-based Euro Stablecoin is being issued by one of the oldest banks in the world. Germany’s Bankhaus von der Heydt (BVDH), created in 1754, is collaborating with tech provider Bitbond for the first direct issuance of a Stablecoin by a banking institution on Stellar. The Stablecoin development comes months after BVDH experimented with tokenized securities on Stellar.
*Stellar (XLM) hit its all-time high of $0.2337 on November 25, since then XLM has been in a downtrend
*At the time of this article, XLM/USD is changing hands at $0.1617, up by 5.78 % on the day
*Stellar-based Euro Stablecoin is being issued by one of the oldest banks in the world
Key Levels
Resistance Levels: $0.2337, $0.2000, $0.1800
Support levels: $0.1350, $0.1200, 0.0900
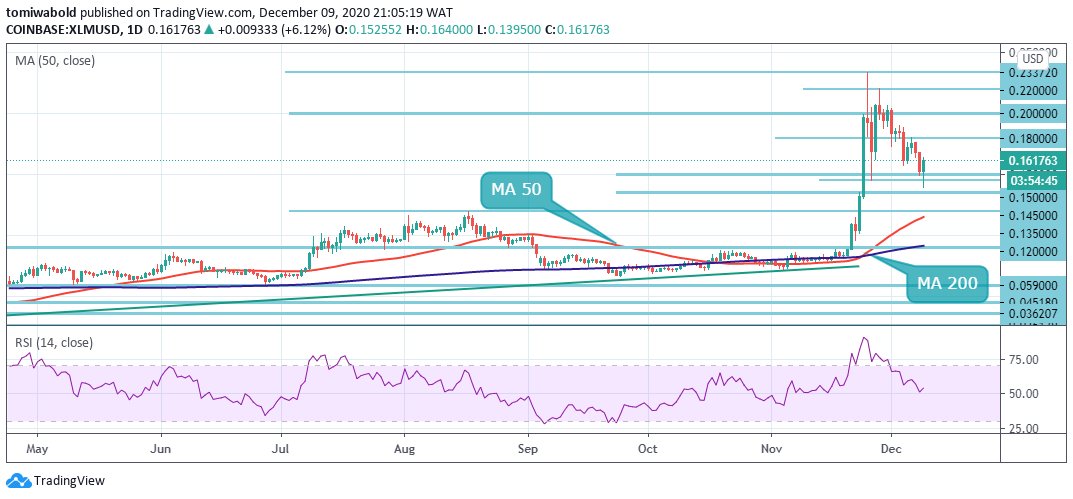 XLM/USD Daily Chart
Stellar (XLM) bounced off at the $0.1500 level to register an intraday high of $0.1640. Support from the broader market would be required for XLM to break back through to the $0.17 region. Stellar bulls must then seek to flip the $0.18 resistance established on Dec 6 into support before the XLM/USD pair could rise beyond $0.20. After this, a short consolidation stint may ensue before a trending move to $0.22 and beyond.
On the flip side, if the price turns southward from current levels, the decline could extend to the $0.1450 support which acted as a backstop for further selling pressure on November 26. Nonetheless in the event this support caves in, bears may regain control of XLM price. In this case, support is seen lying at $0.1350.
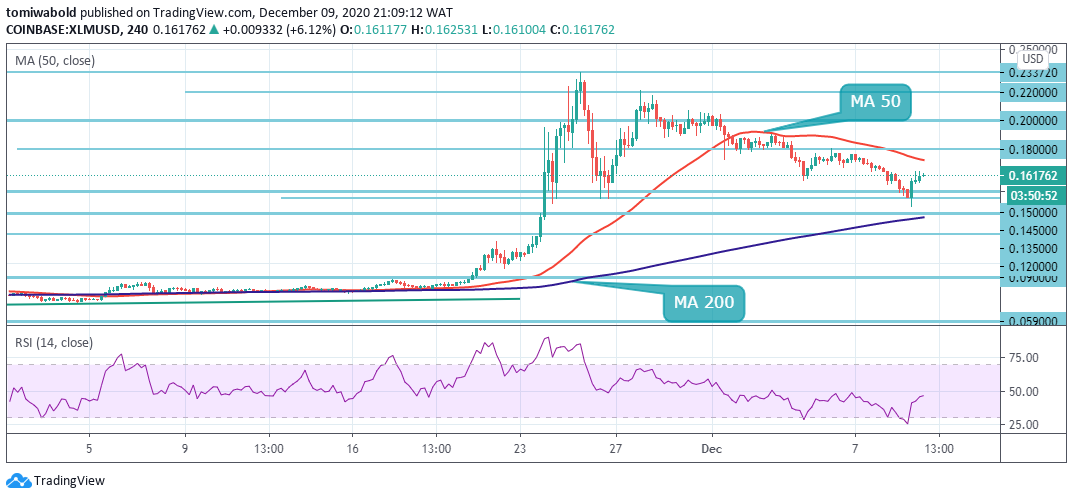 XLM/USD 4-Hour Chart
As seen on the 4-hour chart, XLM lost the MA 50 support at $0.1730 since the start of December. If XLM bulls succeed in reclaiming this support, upside gains beyond $0.20 and then $0.22 may come into the picture. On the downside, if bears sink price beneath its present level, formidable support is envisaged at $0.1450.
If this support fails to hold, declines might overshoot to test the MA 200 at $0.1316. Further down, the next key buyer congestion zones include $0.12 and $0.09. The XLM/USD pair is only bullish while trading above the $0.1350 level, key resistance is found at the $0.18 and the $0.20 levels. If the XLM/USD pair trades below the $0.1450 level, sellers may test the $0.1350 and $0.12 levels.
Note: Kryptomoney.com is not a financial advisor. Do your research before investing your funds in any financial asset or presented product or event. We are not responsible for your investing results
Image Credit: Shutterstock


Keep in mind that we may receive commissions when you click our links and make purchases. However, this does not impact our reviews and comparisons. We try our best to keep things fair and balanced, in order to help you make the best choice for you.
