
The cryptocurrency market represents mixed trading on Wednesday. Stellar (XLM) is stuck consolidating as it tries to scale higher. At the time of writing, XLM was exchanging hands at $0.261, up 1.68% in the last 24 hours. Ranking 21st largest, Stellar market valuation stands at $6.13 billion with a 24-hour trading volume of $371 million. Stellar declined to enter into consolidation shortly after reaching yearly highs of $0.797 on May 16. XLM remains currently down by nearly 67% from the yearly highs as the price enters a make-or-break zone. The Stellar Development Foundation (SDF) recently announced that it will enable an automated market maker (AMM) functionality which will help improve market liquidity via Protocol 18 network upgrade. AMMs remain popular in the DeFi sector, being utilized by decentralized exchanges such as Uniswap and SushiSwap.
Key Levels
Resistance Levels: $0.5000, $0.4000, $0.3000
Support levels: $0.2300, $0.2000, $0.1250
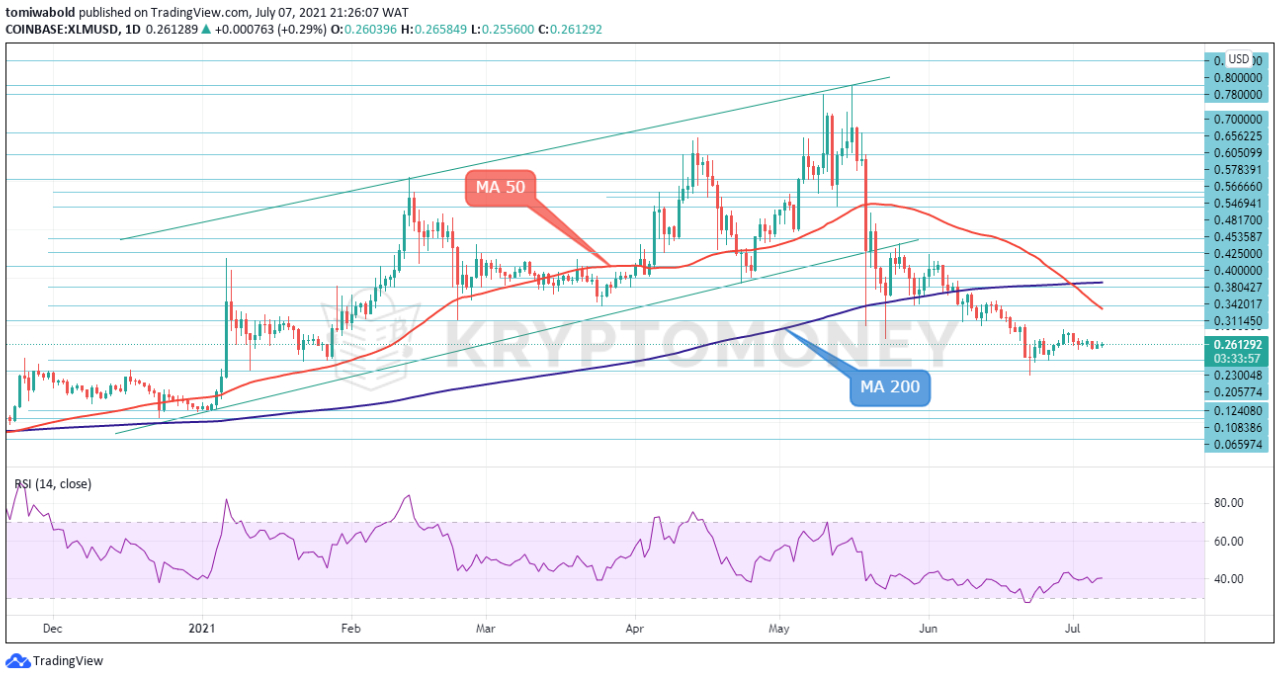 XLM/USD Daily Chart
XLM price slid to lows of $0.198 on June 22 from where it slowly recovered to the range where it trades presently. While price searches for further direction, the formation of a death cross on the daily chart isn’t helping the narrative of the bulls either. Recent studies however indicate the death cross may be a lagging pattern, which forms when a large part of the decline has already occurred. If this happens to be so, there is a chance for a reversal to the upside.
A bounce from current levels at $0.26 will signal investor interest with a potential spike in buying pressure propelling XLM price to take a jab at the MA 50 at $0.336, the bearish thesis may likely be invalidated if Stellar surmounts the roof of the bearish crossover at $0.534. However, if the bearish convergence of the two MAs results in further declines, the crash might drag Stellar to the $0.250 support floor. A further breakdown from here could head to $0.198 or probably $0.14.
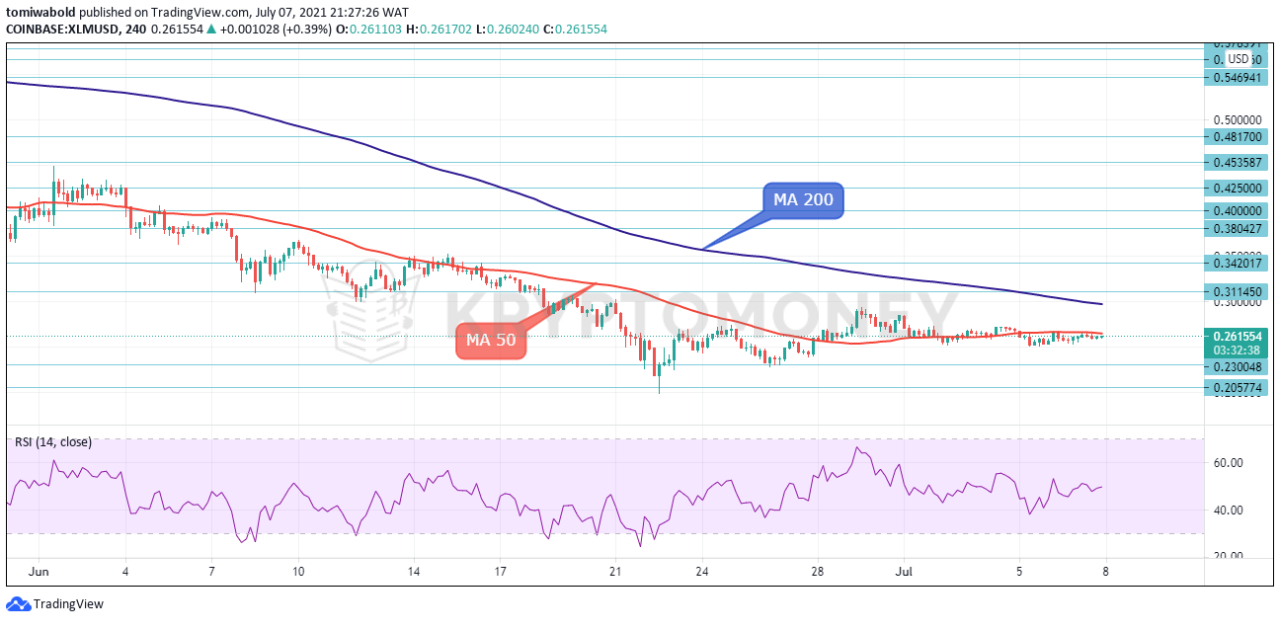 XLM/USD 4-Hour Chart
XLM eased slightly in early Wednesday trading after July 6 price advance failed to clear MA 50 ($0.265) on the first attempt. XLM continues to creep sideways with the MA 200 ($0.299) acting as a cap to further upside advance. That said, only a firm break above the MA 200 would open the way for bullish extension towards the yearly high at $0.797.
A glimpse at the technical oscillators may suggest that positive momentum is struggling, with the RSI zig-zagging towards the 50 neutral levels. Steering the pair deeper, initial support may come from the $0.25 level. Stepping lower may reinforce negative tendencies hitting the $0.22 support ahead of the $0.198 low. All said it appears the XLM/USD pair may edge sideways towards a retest of previous supports before a clearer picture takes form.
Note: Kryptomoney.com is not a financial advisor. Do your research before investing your funds in any financial asset or presented product or event. We are not responsible for your investing results
Image Credit: Shutterstock


Keep in mind that we may receive commissions when you click our links and make purchases. However, this does not impact our reviews and comparisons. We try our best to keep things fair and balanced, in order to help you make the best choice for you.
