The cryptocurrency total market capitalization hit the $2 trillion milestones, as selected Altcoins rally on the back of a consolidative Bitcoin. Stellar (XLM) edged higher on Tuesday after the rebound off MA 50. The digital asset then approached the $0.578 high, which has acted as a strong barrier since mid-February. XLM’s uptrend hits pause at $0.57 following a price rejection. This caused Stellar to pare some intraday gains, trading at $0.50 as at the time of writing. Amid the pullback, Stellar is up 2.38% in the last 24 hours and 23.86% on a 7-day basis. Ranking 12th largest, Stellar market valuation stands at $11.46 billion with a 24-hour trading volume of $5.4 billion. Stellar’s blockchain is set to receive a boost as Akon’s African crypto-cities will utilize Stellar blockchain-based token Akoin (AKN). Senegalese-American rapper and businessperson Akon is set to launch a crypto-city in Uganda while building a much larger one in Senegal for $6 billion.
*Stellar (XLM) edged higher on Tuesday after the rebound-off MA 50
*This caused Stellar to pare off some intraday gains, trading at $0.50 as at the time of writing
*Akon’s African crypto-cities will utilize Stellar blockchain-based token Akoin (AKN)
Key Levels
Resistance Levels: $6500, $0.6083, $0.5783
Support levels: $0.4830, $0.4250, $0.4000
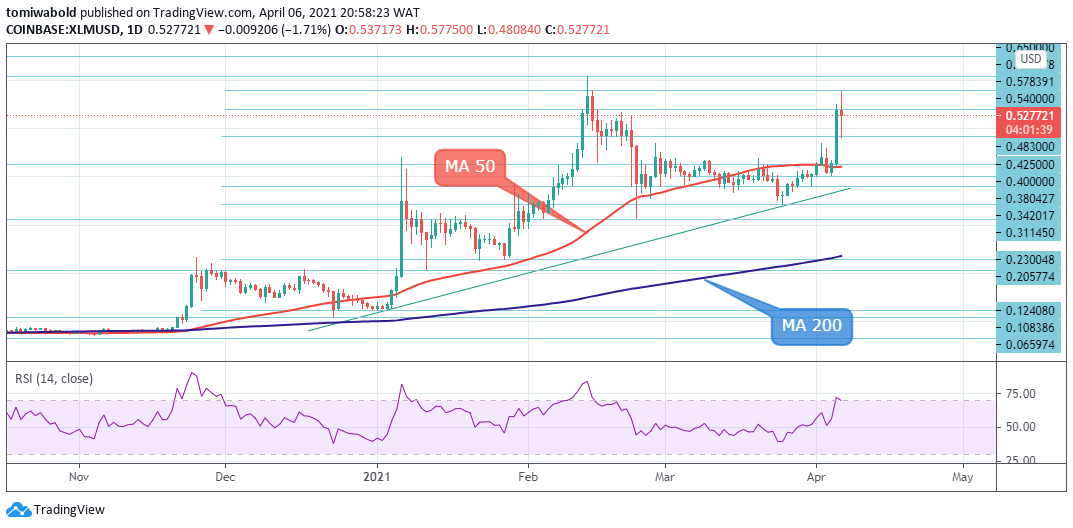 XLM/USD Daily Chart
After weeks of consolidation, stellar(XLM) had a significant break above the MA 50 ($0.42) on Apr. 5 and rose to highs of $0.549. A further climb today near the $0.57 barrier halted the uptrend, triggering a pullback. The XLM/USD pair declined to an intraday low of $0.477 in early trading before a mild rebound. Further declines from the current price may meet immediate support at the day’s low of $0.477.
Even lower, the MA 50 barrier now turned support may cap downside risks. Beneath this, the low from March 25 at $0.336 (ascending trendline support) would be eyed before meeting the $0.32 mark. The RSI still holds in the positive territory. Therefore the pair may begin a rise again from the MA 50. On the upside, resistance could occur at the day’s high at $0.577 and the yearly high at $0.607. Higher still, 2018 all-time high at $0.934 would increasingly come into scope.
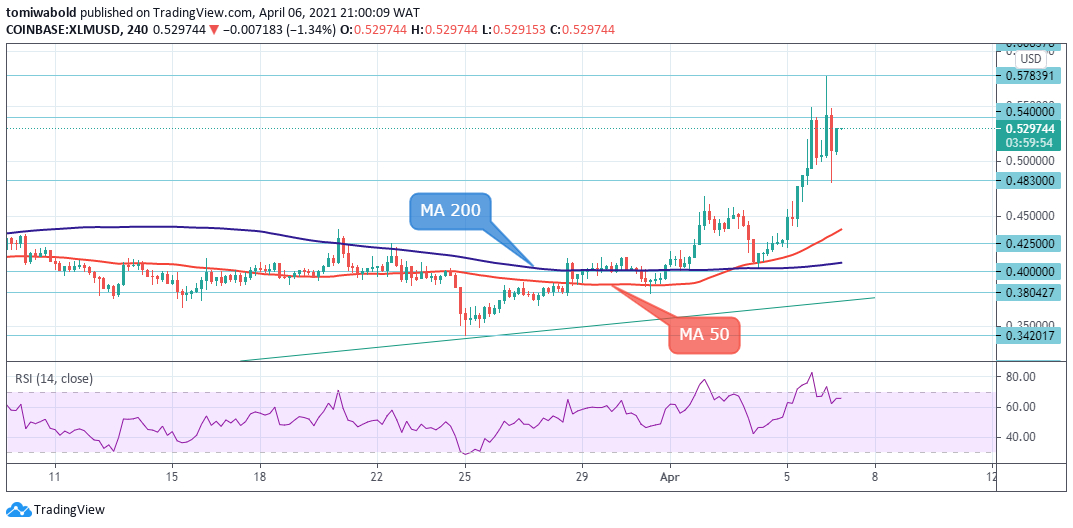 XLM/USD 4-Hour Chart
On the 4-hour chart, Stellar trades well above the MA 50 and 200. XLM is presently consolidating at the $0.52 range while awaiting the next move.
If profound traction transpires off from the $0.52 range, initial upside friction could come at $0.57 before the bulls challenge the resistance ceiling of $0.607. Conquering this obstacle could restore confidence in the pair fuelling a positive impetus towards the 2018 all-time high at $0.943.
On the other hand, if sellers manage to dip the price below the $0.50 range, early tough support could develop from the low at $0.479. However, if the pair deteriorates further, the MA 50 at $0.435 and the neighboring MA 200 ($0.40) could attempt to terminate the decline. XLM/USD positive tone should remain undamaged if the pair manages to remain above the moving averages.
Note: Kryptomoney.com is not a financial advisor. Do your research before investing your funds in any financial asset or presented product or event. We are not responsible for your investing results
Image Credit: Shutterstock


Keep in mind that we may receive commissions when you click our links and make purchases. However, this does not impact our reviews and comparisons. We try our best to keep things fair and balanced, in order to help you make the best choice for you.