The cryptocurrency market uphill battle to new yearly highs is unlikely to stop soon as seen in Bitcoin’s relentless drive. XRP reached its highest level since mid-August at $0.3085 after five days of bullish action. The momentum stalled before $0.31 which aligns as a key hurdle for XRP in late July and early August. The most recent rejection on November 18 forced the XRP price to extend its slide to lows of $0.28 where bulls arrested the decline. The hunt for higher support is still on amongst XRP bulls as seen in price trading at an intraday high of $0.3068. At the time of writing, XRP is exchanging hands at $0.3005, up by 3% on the day. The XRP market cap stands at $13.54 billion, as calculated from a 45.32 billion free float supply. There has been a total of $5.04billion in trade volume over the past 24 hours. XRPL Labs recently announced the beta release of the Ripple banking app XUMM. XUMM is a decentralized app that combines all the functions of traditional online banking in one application. The productive version is set to launch and made available to the public soon.
*XRP reached its highest level since mid-August at $0.3085 after five days of bullish action
*At the time of writing, XRP is exchanging hands at $0.3005, up by 3% on the day
*XRPL Labs recently announced the beta release of ripple banking app XUMM
Key Levels
Resistance Levels: $0.3463, $0.3262, $0.3100
Support Levels: $0.2850, $0.2700, $0.2600
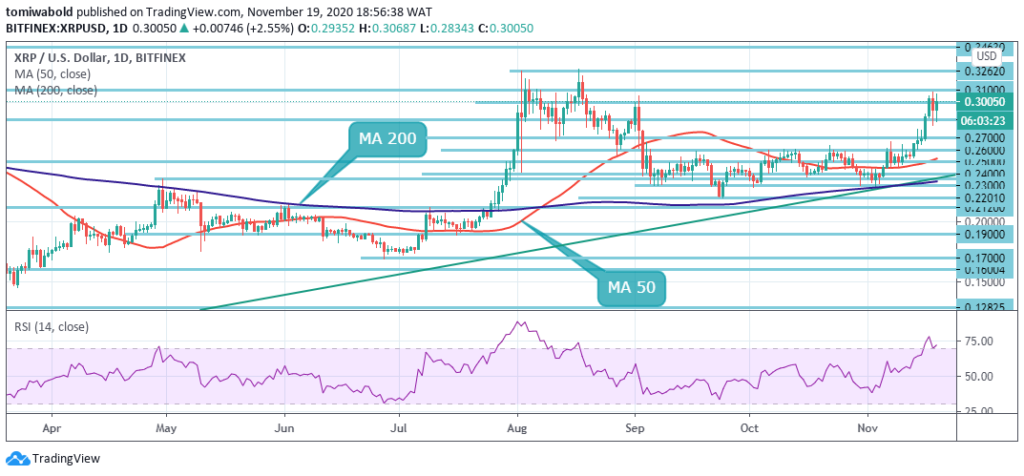 XRP/USD Daily Chart
As seen on the daily chart, after a price rejection at $0.31 on November 18, XRP bulls moved to arrest the decline at $0.28. If the bulls succeed in another attempt to push the price from the previous high of $0.3085 past the $0.31 resistance level, the next level where the bears may again launch a stiff resistance is $0.3262. The key to XRP’s uptrend lies in a decisive break beyond the $0.31 barrier which could bring in more buyers and provide a boost to XRP.
On the flip side, the bullish outlook will be invalidated if the XRP/USD pair dips below $0.2750 marks, then XRP may test the key support at $0.2700. If this support caves in, XRP may test the MA 50 support at $0.2527. The ascending trend line coming from early March may cushion further losses.
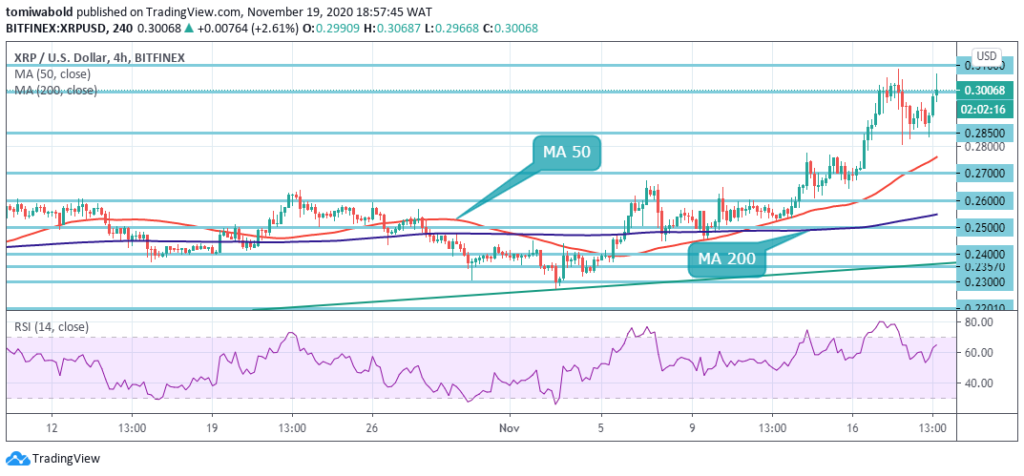 XRP/USD 4-Hour Chart
On the 4-hour chart, bulls seem to be in control as seen in the upsloping moving averages and the RSI near overbought territory. The mission among the bulls is simple to hunt for higher support to push the uptrend past $0.3. If this mission fails, XRP will likely find support at $0.2850. However, if push comes to shove, XRP may extend the bearish leg to the MA 50 at $0.2751 and the MA 200 at $0.2550.
The XRP/USD pair is only bullish while trading above the $0.2700 level, key resistance is found at the $0.3100 and the $0.3262 levels. If the XRP/USD pair closes beneath the $0.2850, sellers may test the $0.2700 and $0.2600 support levels.
Note: Kryptomoney.com is not a financial advisor. Do your research before investing your funds in any financial asset or presented product or event. We are not responsible for your investing results
Image Credit: Shutterstock


Keep in mind that we may receive commissions when you click our links and make purchases. However, this does not impact our reviews and comparisons. We try our best to keep things fair and balanced, in order to help you make the best choice for you.
