Ripple (XRP) is a network coin and transaction framework that seeks to rival the SWIFT financial protocol. Given the dramatic loss in recent months, XRP still stays as one of the largest, well-known, and most widely traded crypto assets. Reportedly, XRP is down nearly 50 percent from the high of the year on February 15. The market cap of XRP stands at $7.82 billion premised on a circulating supply of 44.2 billion XRP, with $1.0 billion in the volume of trade over the past 24 hours. The coin is rising in value at $0.1768 at the time of this post, having increased more than 1.4 percent since the start of the day. It was undoubtedly in a sharp downward trend as key support lifts XRP/USD towards sub $0.1800. XRP whales have recently gone on an accumulation drive holding over 85 percent of its supply. Every percentage tier “exclusive” (from 0.01 percent to 1 percent) has seen a substantial increase in the number of tokens kept, ledger.exposed reported.
*The coin is rising in value at $0.1768 at the time of this post, having increased more than 1.4 percent since the start of the day
*It was undoubtedly in a sharp downward trend as key support lifts XRP/USD towards sub $0.1800
*XRP whales have recently gone on an accumulation drive holding over 85 percent of its supply
Key Levels
Resistance Levels: $0.2000, $0.1900, $0.1800
Support Levels: $0.1766, $0.1700, $0.1600
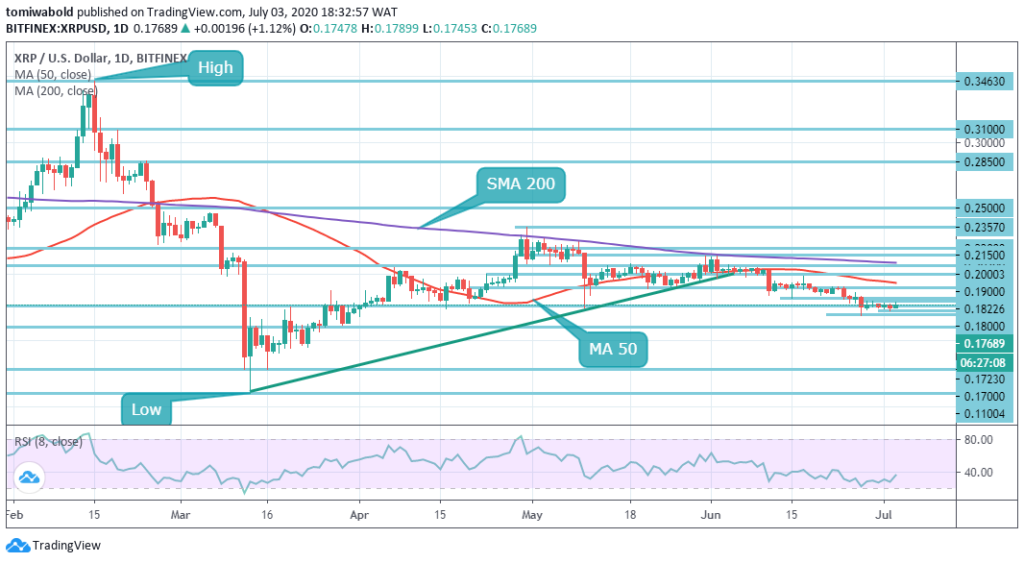 XRP/USD Daily Chart
As shown on the daily, XRP/USD bulls re-entered the market after a bearish week as the price went up from $0.1745 to $0.1789. The price is trending beneath the red MA 50, while the RSI reveals a renewed effort to exit the bearish market momentum. The holding horizontal support line had four straight sessions of that sideways trading at $0.1766.
There are many strong technical barriers huddled both beyond and beneath the existing price, meaning for the time being XRP may tend to fluctuate within a range. The lower support constraints at $0.1600 are a buy region while the upper resistance confines at $0.1900 are a sell zone. The trend may continue to stay bearish until either zone is conclusively breached by the asset.
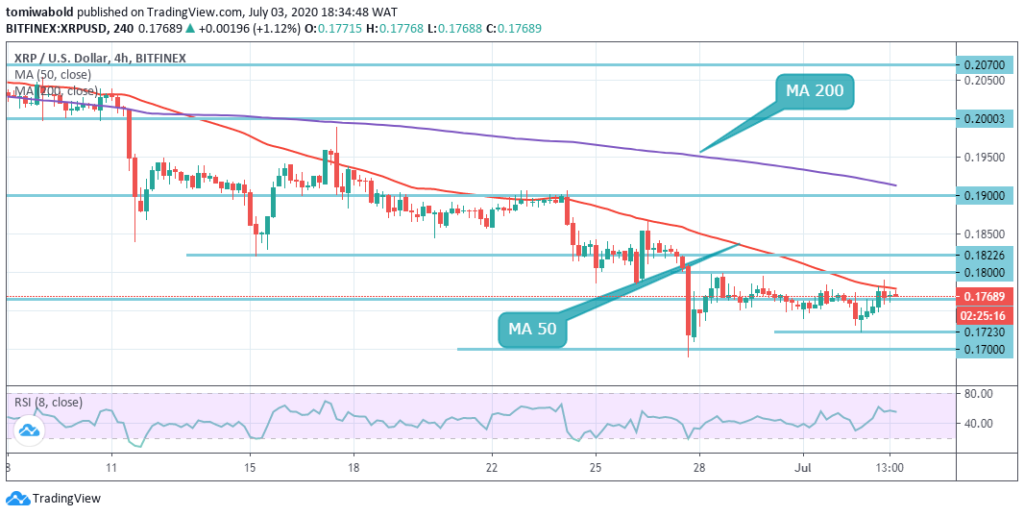 XRP/USD 4-Hour Chart
On the intraday chart, XRP/USD initiated recovery beyond 4-hour MA 50, but the upside traction receded off as the channel resistance was approached. The horizontal line offers local support at $0.1766. The sell-off may be stretched to $0.1700 once breached. At this juncture, though, XRP appears to have established a higher low at $0.1723.
The prevailing downtrend can only be reversed if both the resistances of MA 50 and MA 200 are displaced. The bullish goal of the recent channel breakout is situated around the technical region of $0.1800 according to chart assessment. The XRP/USD pair is bullish while exchanging beyond the level of $0.1900, key resistance is discovered at $0.1800 and $0.1822. If the XRP/USD pair exchanges beneath the $0.1766 level, sellers may test the support levels of $0.1723 and $0.1700.
Note: Kryptomoney.com is not a financial advisor. Do your research before investing your funds in any financial asset or presented product or event. We are not responsible for your investing results
Image Credit: Shutterstock


Keep in mind that we may receive commissions when you click our links and make purchases. However, this does not impact our reviews and comparisons. We try our best to keep things fair and balanced, in order to help you make the best choice for you.