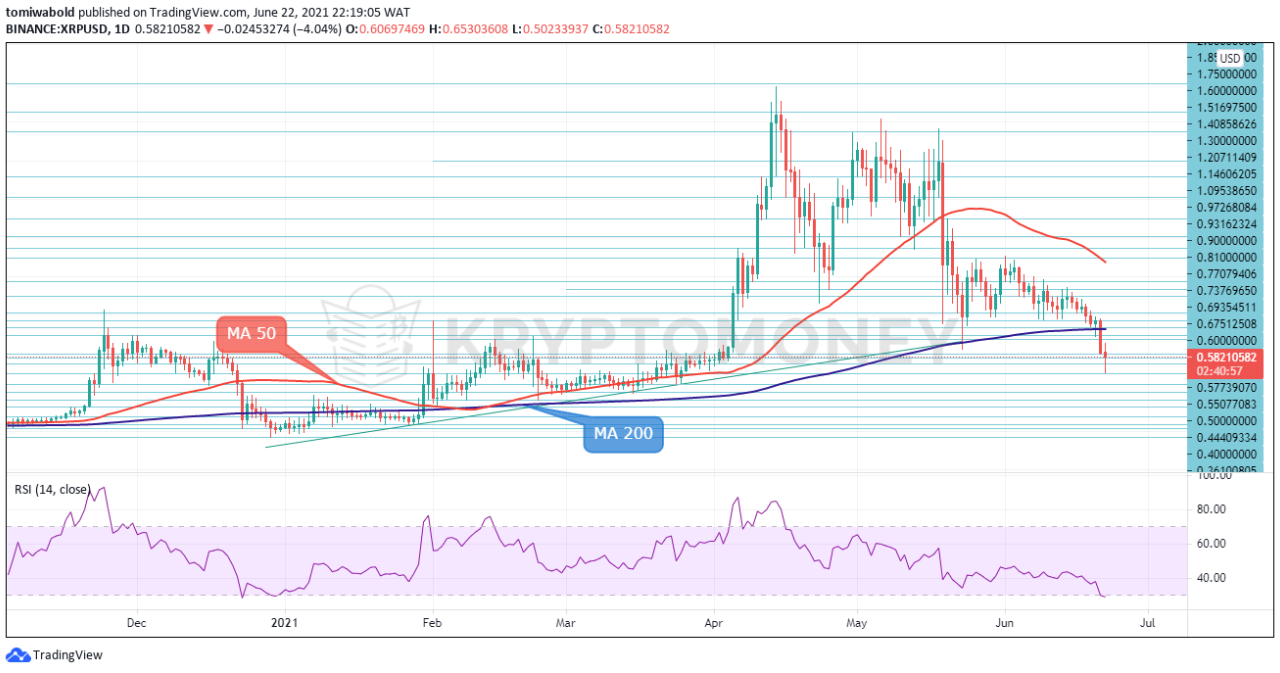
Investors awoke to another round of price declines on June 22 as the broader cryptocurrency market succumbed to bearish action. XRP, just like most crypto assets declined, plunging by nearly 35% from highs of $0.78 on June 21 to lows of $0.50 on June 22, registering the largest two-day decline since December 2020 when SEC filed its lawsuit against Ripple. At the time of writing, XRP recovered slightly to trade at $0.582, down by 13.51% in the last 24 hours. Ranking 6th largest, XRP present market capitalization stands at $26.93 billion and $5.11 billion in traded volume over 24 hours. The extension of the recent sell-off to lows of $0.50 on June 22 brings XRP price back to the same level from where it kickstarted the rally to its yearly highs in late March. Also, the oversold RSI reading suggests the likelihood of a seeming relief rally or at least a dead-cat bounce.
Key Levels
Resistance Levels: $1.1460, $0.9000, $0.7376
Support Levels: $0.5000, $0.4000, $0.3248
 XRP/USD Daily Chart
XRP is on track for posting two days of declines. The declines come after Sunday’s brief rise to the $0.79 level. Following the dip to lows of $0.50 on June 22, XRP might seek a rebound. The RSI in oversold levels below 30 suggests that bears could temporarily take a breather to allow bulls’ passage. However, the gains could be capped near the $0.65 level ahead of the MA 200 ($0.72) where resistance might come in.
A jump higher could take the bulls to the MA 50 at $1.07 which could set the stage for a retest of the $1.98 yearly high. Alternatively, if the XRP/USD pair continues to move south, it would send the market until the $0.36 level ahead of the yearly low, which currently stands at $0.19.
 XRP/USD 4-Hour Chart
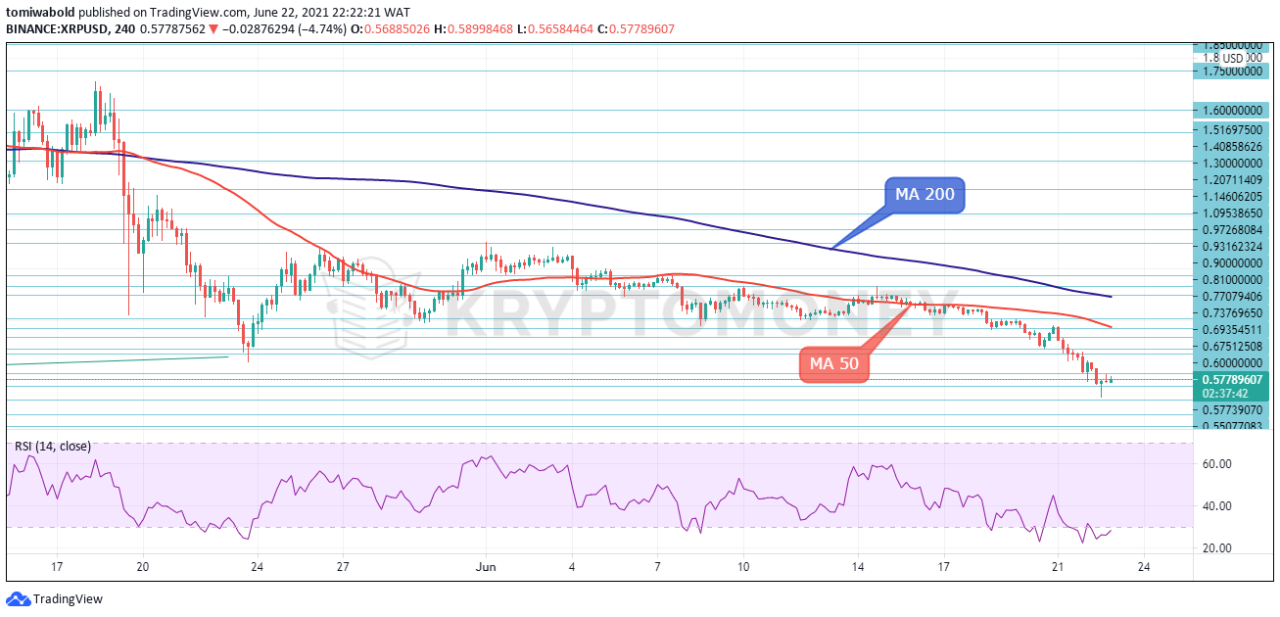
Since the start of June, XRP has been consolidating in a range around the MA 50 ($0.78). The range resolved following the recent sell-off and XRP price fell to lows of $0.50. The price action seems quite weak at the moment with the RSI flattening in the oversold area. As a result, XRP prices could exhibit low volatility. The current declines can be stalled with a retest of the minor trend line support at $0.50.
A break down below this trend line might push XRP price to $0.36 and $0.19 yearly lows. To the upside, the MA 50 barrier at $0.78 remains to be cleared to emphasize bulls’ re-entry. Above this line, the MA 200 at $0.89 could halt the bullish actions. Summarizing, a close above the $0.65 level and forming support here could give XRP further upside gains.
Note: Kryptomoney.com is not a financial advisor. Do your research before investing your funds in any financial asset or presented product or event. We are not responsible for your investing results
Image Credit: Shutterstock
Keep in mind that we may receive commissions when you click our links and make purchases. However, this does not impact our reviews and comparisons. We try our best to keep things fair and balanced, in order to help you make the best choice for you.