
With a steady bullish momentum, the third-largest digital asset with its current market cap of about $9 billion has shifted in alignment with other Altcoins. By a 4.49 percent increase in the last 24 hours, XRP looks decent. Recently, the XRP token of Ripple has been on the rise, slowly reaching the level of $0.20 while XRP Circulating supply hits a new all-time high of 43,978,966,311 (as per CoinMarketCap). XRP seems to have followed the pattern of most popular coins as ODL remittance payments indicate a volume rise and XRP recently achieved a new listing on top 50 cryptocurrency exchange WhiteBIT paired with BTC and USDT.
*Steady Bullish momentum on XRP/USD past $0.2000
*XRP is looking decent with a 4.49% increase over the last 24 hours
*Surge in ODL remittance payments indicate a volume rise and exchange listing
Key Levels
Resistance Levels: $0.2400, $0.2200, $0.2000
Support Levels: $0.1850, $0.1766, $0.1600
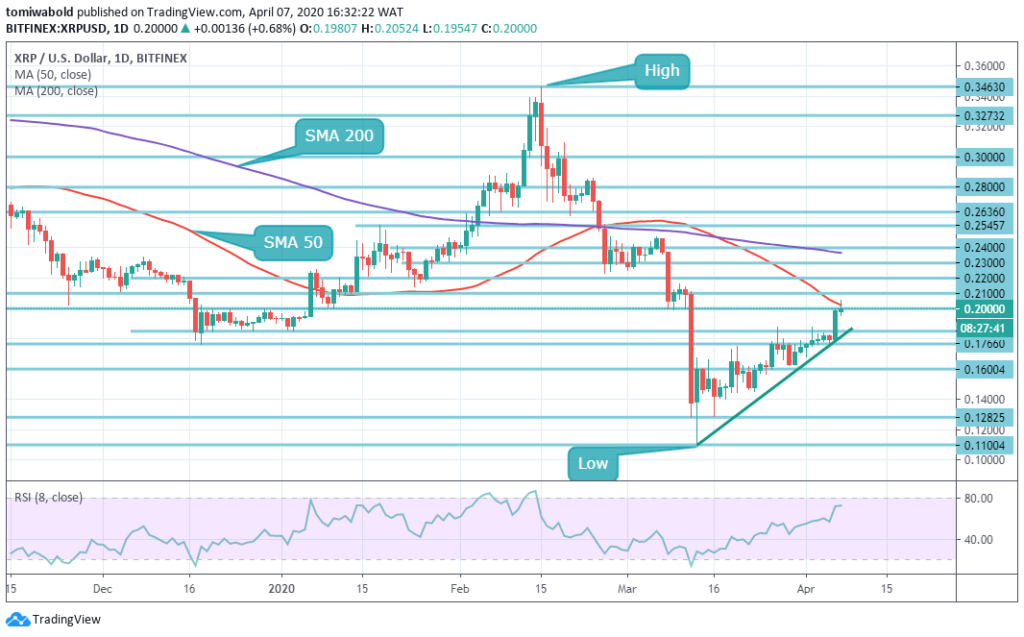 The price of XRP went straight up after the latest upward advance and passed through the upper side of the horizontal line, at the $0.1850 and the $0.2000 levels. It’s now in a zone of preceding consolidation while trading with steady bullish momentum along the daily RSI overbought region.
Ripple’s performance on the market is the most notable of late, moving to be nearly equal to Ethereum. Ripple’s technical set-up tends to look more optimistic with the daily chart suggesting some optimism for the mid to long-term. Once XRP crosses resistance at $0.2100 level, continuing much higher and reaching the level of $0.2400 level (March 2020 highs) will be evident.
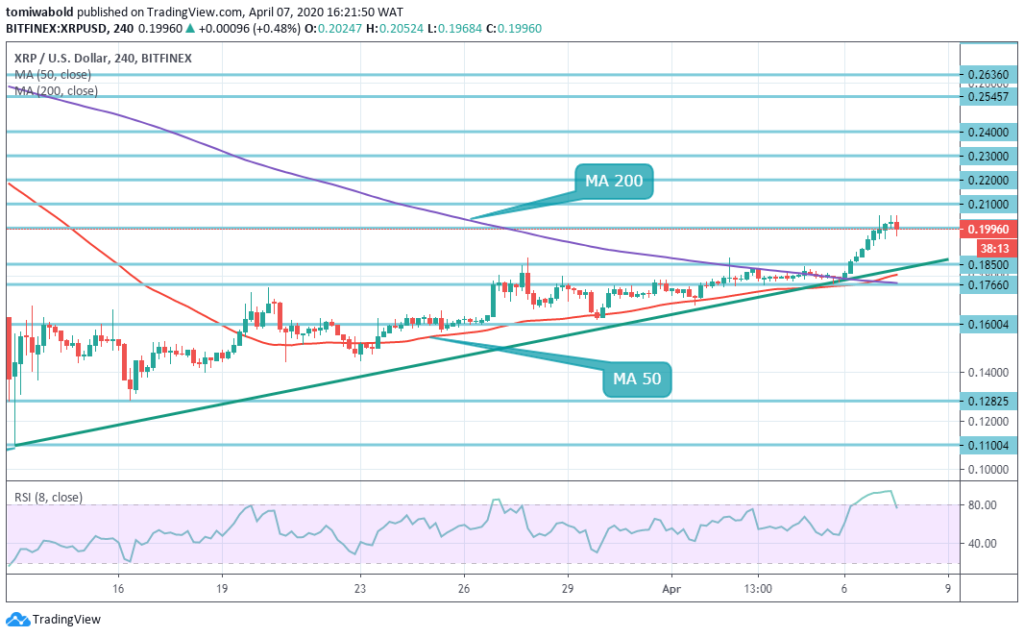 XRP/USD is supported by the upward trendline at $0.1850 level, on an intraday basis. When out of the path, the downside is likely to gain momentum with the next target on the level of $0.1766 psychological zone, reinforced by the lower line of the moving average of 50.
The next support is established at $0.1600 level via the confluence zone horizontal support line. The upside trendline offers critical support at $0.1800 level. Underneath these support zones, a sustainable change may reverse the immediate bullish case.
Note: Kryptomoney.com is not a financial advisor. Do your research before investing your funds in any financial asset or presented product or event. We are not responsible for your investing results
Image Credit: Shutterstock


Keep in mind that we may receive commissions when you click our links and make purchases. However, this does not impact our reviews and comparisons. We try our best to keep things fair and balanced, in order to help you make the best choice for you.
