
Since breaking beneath pivotal moving average, Ripple’s XRP has stayed in a shifting spot throughout the weekend. The break beneath $0.2 has led XRP to drop its long-lasting 3rd place rating to the USDT Stablecoin-Tether among top cryptocurrencies by market cap. XRP currently has a market cap value of $8.7 billion while Tether has a market cap of $8.8 billion as it pushes XRP to 4th place. XRP/USD is losing value at $0.1975 at the time of this post; the medium-term bias remains bearish. The price of the third-largest digital asset has shifted slightly since the beginning of the day and in the last 24 hours. A recent report by the Consumer Financial Protection Bureau (CFPB) revealed that the agency has been tracking developments regarding transparency and adoption in the remittance market. Specifically, the CFPB stressed that XRP could be used to secure cross-border money transfer settlements.
*XRP/USD is losing value at $0.1975 at the time of this post; the medium-term bias remains bearish
*XRP currently has a market cap value of $8.7 billion while Tether has a market cap of $8.8 billion as it pushes XRP to 4th place
*(CFPB) revealed that the agency has been tracking developments regarding transparency and adoption in the remittance market.
Key Levels
Resistance Levels: $0.2200, $0.2150, $0.2070
Support Levels: $0.1900, $0.1766, $0.1600
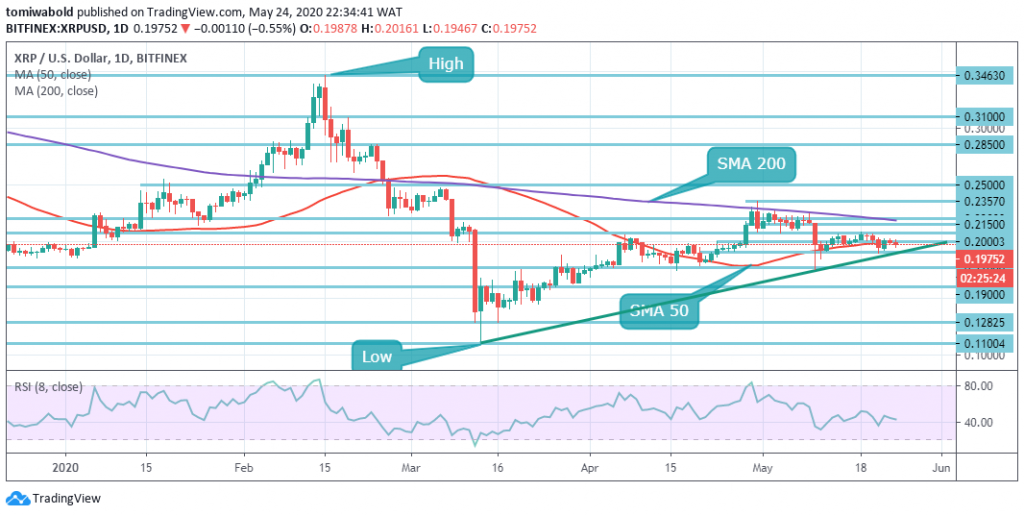 XRP/USD Daily Chart
Despite its remarkable progress over the past few weeks, XRP has attempted to break in the past week on several instances beyond the daily MA 200. Lately and throughout the historic price movements of XRP the daily MA 200 has become a significant level of resistance, causing immense pullbacks.
The first support level can be discovered at $0.1900 (0.382 retracements) once sellers push lower. On the other side, once buyers can regain $0.2000, the first level of strong resistance is $0.2070, beyond that, $0.2150, $0.2200 resistance is projected. The RSI is heading beneath level 50 which is showing weak bearish momentum on the market. When the RSI continues to plummet, then XRP might be projected to reach through and maybe even underneath the $0.1900 support.
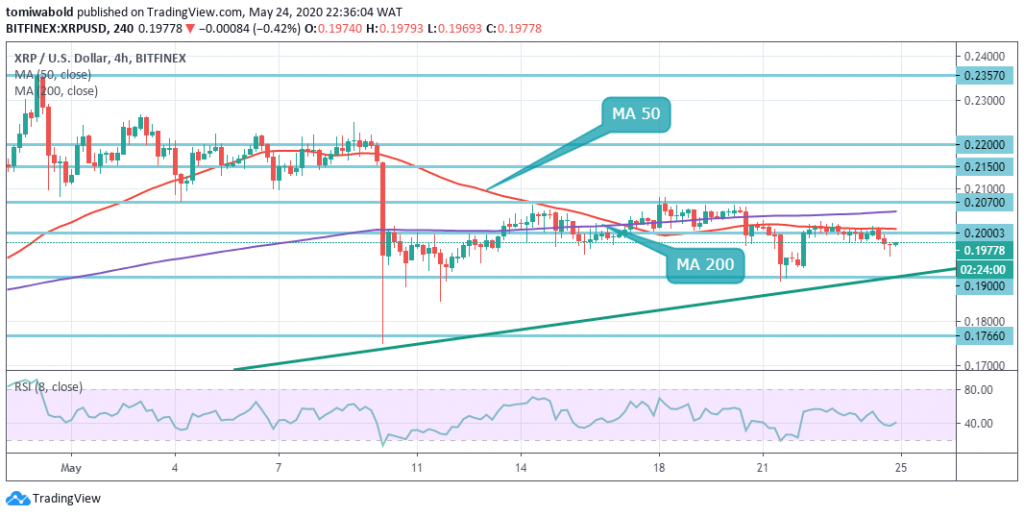 XRP/USD 4-Hour Chart
Recovery for XRP is constrained by MA 50 on the 4-hour time frame (currently at $0.2010). A stable push beyond this region may boost the analytical context, but for growth to gain traction, we may have to see follow-through to $0.2070. A feasible push beyond this area may enable an enhanced positive side to $0.2150 and $0.2200 which has held as the top line of the recent consolidation channel.
On the contrary, the fall at $0.2010 beneath 4-hour MA 50 puts the next emphasis at $0.1900 on the horizontal support level. Once breached, the sell-off may be extended at $0.1766 (psychological near-term swing low level of the MA 50 as seen on the daily chart) towards a 10th May low-level retest. A rejection from here would imply a price bounce activity over the coming weeks, which is likely to trigger a $0.2357 high April 30 retest.
Note: Kryptomoney.com is not a financial advisor. Do your research before investing your funds in any financial asset or presented product or event. We are not responsible for your investing results
Image Credit: Shutterstock


Keep in mind that we may receive commissions when you click our links and make purchases. However, this does not impact our reviews and comparisons. We try our best to keep things fair and balanced, in order to help you make the best choice for you.