After a brief period of consolidation pulling Ripple (XRP) along with the trend in its USD pairing, the crypto-currency market has resumed recovery. Consequently, in their various BTC pairs, some Altcoins were smashed, and maybe even XRP as Bitcoin (BTC) price broke out of the two-month range and hit as high as $11,400. XRP’s USD pairing exhibited great intensity as it rose past $0.20 mark. The upside pressure on XRP/USD had gained traction and unleashed bulls toward $0.25. XRP reached the intraday high at $0.2442 and retreated by press time to $0.2384. The coin is the day’s ultimate gainer out of the top-5 over the past 24 hours, with over 8 percent rise. The market cap on the XRP is $10.69 billion, estimated from a free float supply of 44.85 billion. Trade volume has been reaching $1.99 billion over the past 24 hours. Within the last 24 hours, XRP has seen a surge over Whales’ activity as Ripple has transferred more than $19.18 million worth of XRP, as per XRP-watching bot XRPL Monitor.
*The upside pressure on XRP/USD had gained traction and unleashed bulls toward $0.25
*The coin is the day’s ultimate gainer out of the top-5 over the past 24 hours, with over 8 percent rise
*Within the last 24 hours, XRP has seen a surge over Whales’ activity as Ripple has transferred more than $19.18 million worth of XRP
Key Levels
Resistance Levels: $0.2500, $0.2357, $0.2119
Support Levels: $0.1900, $0.1700, $0.0.1500
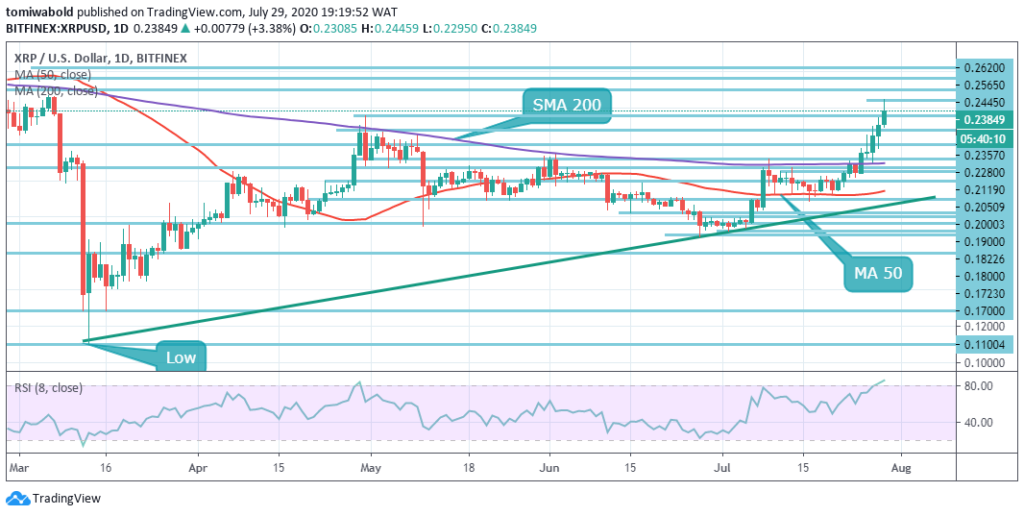
 XRP/USD Daily Chart
As shown on the daily, XRP’s USD pairing is exhibiting tremendous strength as it breached beyond the level of $0.20. Save for the level of $0.20, XRP prices also rose through the MA 50 and MA 200, thus exhibiting signs of more bullish traction. Beforehand, the chart shows a strong higher-low, which is one of the key elements of upward traction. The price is now higher, as it surpassed the previous high at $0.2280
The first resistance level is beyond the current price at $0.2500, then the second at $0.2565 and the third at $0.2600. Beneath the current price, the initial support level is $0.2357, then the next support level is $0.2280 and the third support level is $0.2200. Largely, it is in the bull territory as long as it retains support beyond the MAs, and dips are been viewed as possible buy avenues.
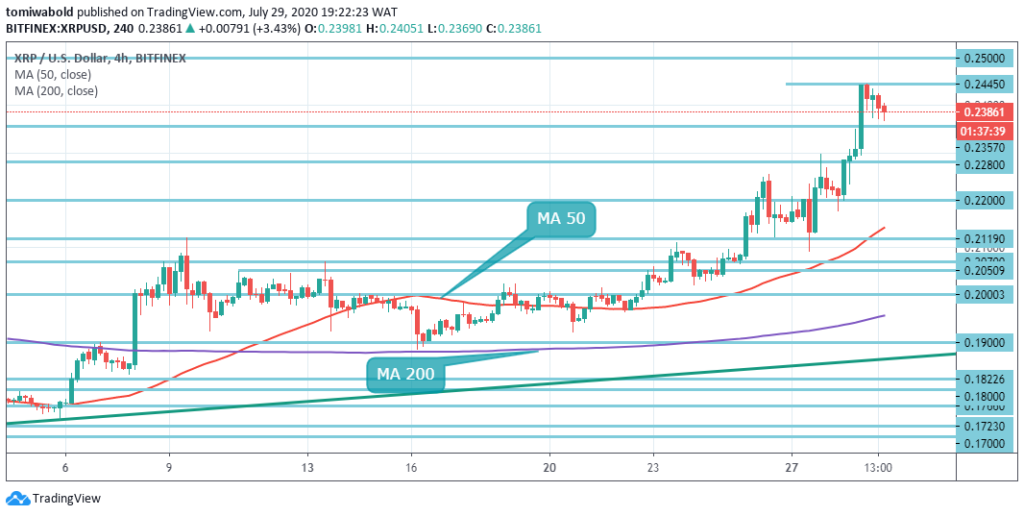
 XRP/USD 4-Hour Chart
XRP/USD capped the rebound at $0.2442 and retreated by the time of writing to $0.2386. The asset retreats from the overbought zone, rendering it exposed to a short-term correction. Nevertheless, the RSI stays up past the 50 marks on the 4-hour chart and shows no signs of reversal so far, implying that the asset hasn’t lost its bullish strength.
The intraday high establishes initial resistance at $0.2442. If it’s out of the path, the upside is possible to gain momentum with $0.2500 being the next priority. Over the medium term, the horizontal line of resistance establishes the pivotal barrier at $0.2620, followed by further obstacles to the psychological $0.3000 level. On the downside, the primary target for correction is established by the horizontal support confluence zone on the path to $0.2200.
Note: Kryptomoney.com is not a financial advisor. Do your research before investing your funds in any financial asset or presented product or event. We are not responsible for your investing results
Image Credit: Shutterstock
Keep in mind that we may receive commissions when you click our links and make purchases. However, this does not impact our reviews and comparisons. We try our best to keep things fair and balanced, in order to help you make the best choice for you.