Most cryptocurrencies are trading broadly higher on Wednesday as renewed optimism keeps sentiment elevated. XRP surges sharply today, testing the $0.746 level during today’s trading session. At the time of writing, XRP was trading at $0.730, up by 15.42% on a 24-hour basis and 33.12% weekly. Ranking 6th largest, XRP present market capitalization stands at $31.82 billion and $3.03 billion in traded volume over 24 hours. Ripple’s first On-Demand Liquidity (ODL) service implementation goes live in Japan, setting the stage to drive more adoption of crypto-enabled services in the region. Zooming out, the launch of the ODL is part of Ripple’s explosive growth in the larger Asia-Pacific (APAC) region. The Asia Pacific remains one of the fastest-growing regions for Ripple with transactions growing 130% year-over-year.
Key Levels
Resistance Levels: $1.1460, $0.9000, $0.7707
Support Levels: $0.5450, $0.4799, $0.4000
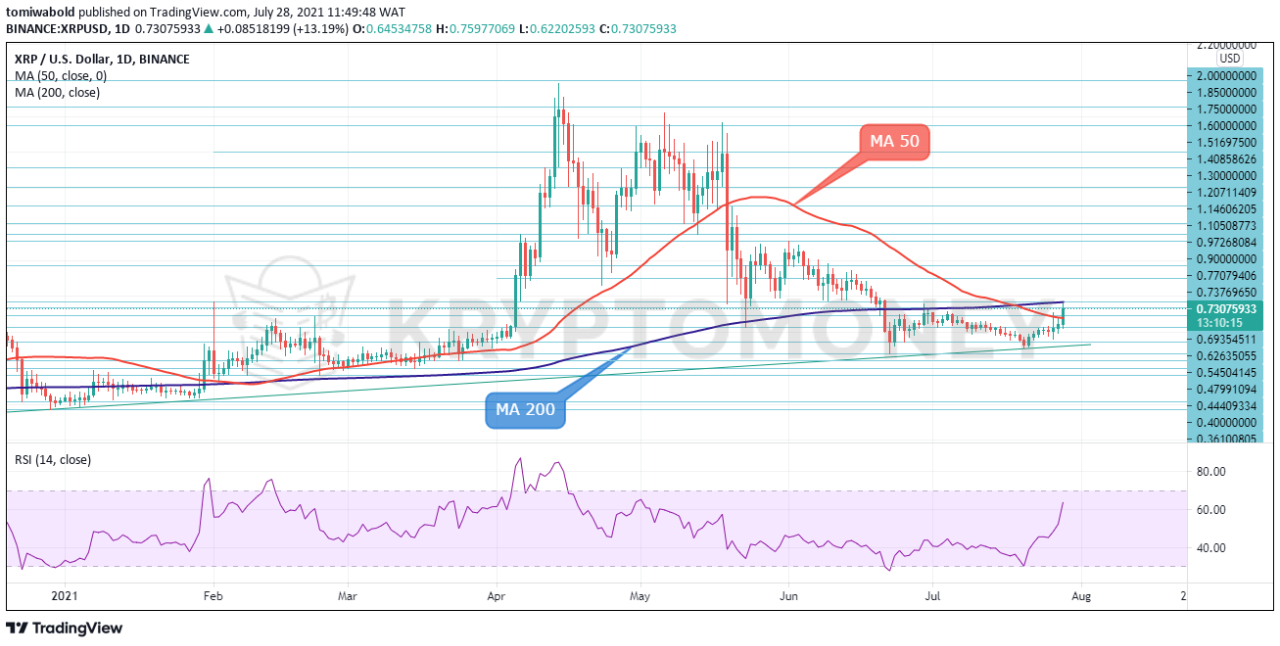 XRP/USD Daily Chart
Fresh bulls came ticks ahead of $0.60 and turned the focus towards the $0.75 level, with firmly bullish studies on larger timeframes being supportive. Noteworthy that the XRP price has been climbing higher since July 21 after hitting support at $0.581. The RSI is reflecting the current bullish move, having entered the positive territory above 60. Technically, XRP/USD is worth a watch in the coming trading sessions.
Break of the MA 200 barrier at $0.763 may be the first sign that the corrective pattern from 19 May has reneged. We might then see the XRP/USD pair accelerate upwards to $1.10 and then $1.29 level next. Close above $1.29 would generate a bullish signal which might target attack at the $1.98 yearly high. Shallow correction is expected due to improved sentiment, with dips to be ideally contained at $0.51-$0.60 zone and provide better levels to re-enter the market.
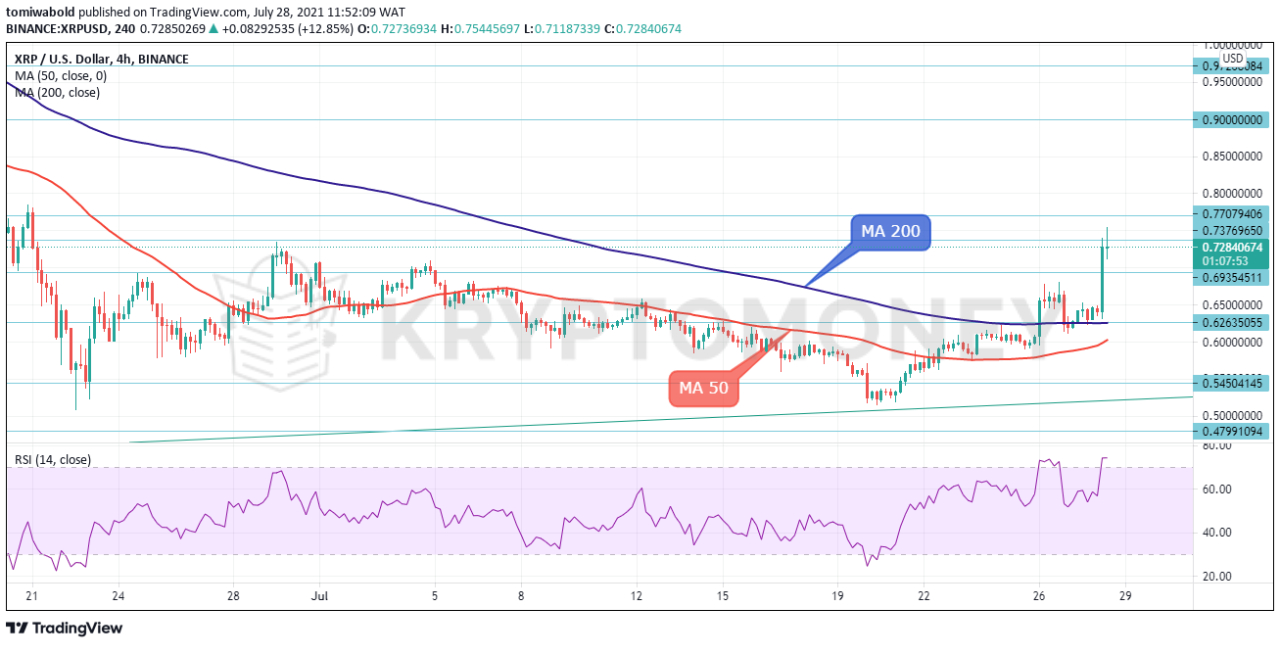 XRP/USD 4-Hour Chart
Technical indicators suggest buying signals on the 4-hour chart, with the RSI peaking above the 70 overbought levels. Most likely, bullish traders are likely to pressure the XRP/USD higher during the following trading sessions. However overbought conditions may produce headwinds and pause bulls for price adjustment. On the upside, the barrier at $0.81 could provide resistance for the XRP/USD pair ahead of the $1.10, $1.29, and $1.78 yearly high in the coming sessions.
Alternatively, immediate support is envisaged at a $0.67 level. The moving averages 50 and 200 at $0.625 and $0.602 respectively are expected to act as main support. Further dips may test support at $0.56 ahead of the $0.51 low. To summarize, the XRP/USD pair remains well bid above the 4-hour moving averages as the oscillators like the Relative Strength Index (RSI) have surged to the highest level in weeks. While the XRP pair may keep rising, a short pullback cannot be ruled out as some bulls take profit.
Note: Kryptomoney.com is not a financial advisor. Do your research before investing your funds in any financial asset or presented product or event. We are not responsible for your investing results
Image Credit: Shutterstock


Keep in mind that we may receive commissions when you click our links and make purchases. However, this does not impact our reviews and comparisons. We try our best to keep things fair and balanced, in order to help you make the best choice for you.