Ripple (XRP) grapples to advance its recovery traction at the end of the week beyond $0.2000 as the bulls stay in a hang tight-and-see for the fourth consecutive session. The 4th-most popular digital currency posts small gains around $0.2050 but stays on track to register about 1 percent gain in 24hrs. Its market capitalization amounts to $9.02 billion. As the price advances the rangebound amidst triangle pattern past $0.2000, the bears are seen battling control back, as indicated by the immediate technical set-up. Though XRP/USD is exhibiting upward traction towards a $0.2150 barrier. Ripple’s Xpring initiative, launched in 2018, has invested more than $500 million so far in more than 27 projects including Compound, Dharma, Securitize, Bitso and Forte. Most of Xpring’s investments relate to the core business model of Ripple, based on XRP and innovation of payments. However, only two investments have been seen this year.
*As price advance the rangebound amidst triangle pattern past $0.2000, the bears are seen battling control back
*Though XRP/USD is exhibiting upward traction towards a $0.2150 barrier
*Ripple’s Xpring initiative, launched in 2018, has invested more than $500 million so far in more than 27 projects
Key Levels
Resistance Levels: $0.2500, $0.2357, $0.2150
Support Levels: $0.2000, $0.1900, $0.1766
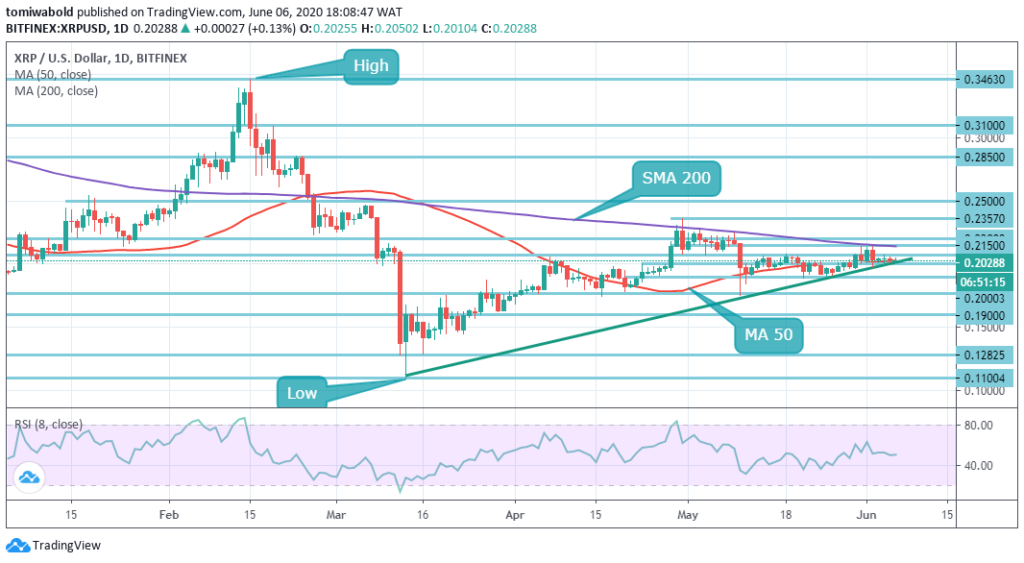 XRP/USD Daily Chart
XRP has been in clear trading sideways, as it progresses into a relatively low volume and uncertain swing trading weekend. Under the daily MA 200, the fourth largest cryptocurrency in the globe continues to grapple. While XRP continues to trade beneath MA 200, conversely, it’s almost unrealistic to be bullish, what’s even more probable is the extension of the macro bear market, which would see the support level of $0.1600 return to the picture.
Once XRP could also continue to find an injection of buyers’ interest, it may commence rallying to around $0.2357 before actually testing the yearly high at $0.3463. Ending a daily candle beyond $0.35 is ambitious, and may post the first considerably higher low of XRP in a long time, validating the anticipated bullish narrative.
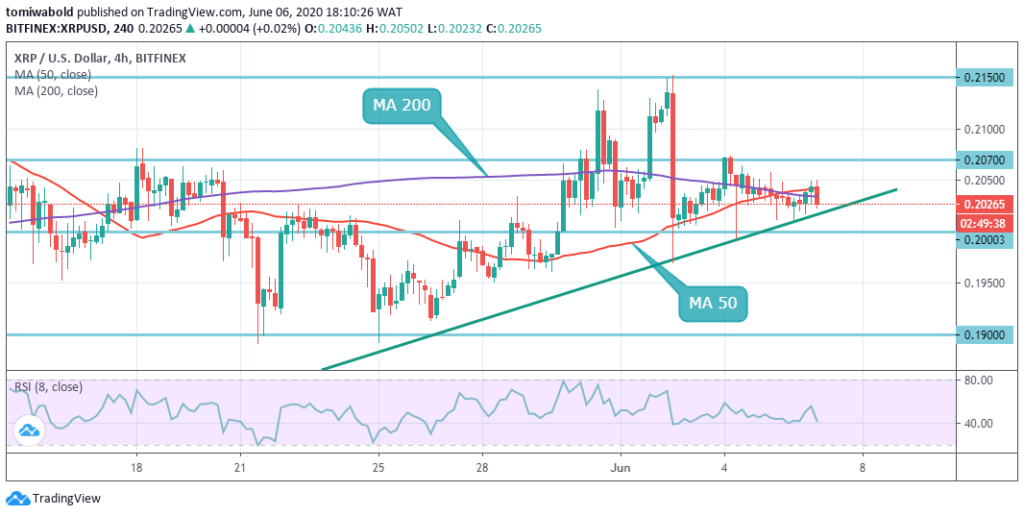 XRP/USD 4-Hour Chart
As illustrated on the 4-hour chart, XRP/USD varies within an ascending trendline amongst gains and losses, with a split in any direction due on the cards. That being said, staring at the structure, the upside seems more persuasive, as a bunch of reasonable levels of support tends to defend the downside.
Whereas, a test of ascending trendline support may be attempted at $0.2000 should the sellers seize control. A violation of the latter may suggest a decline in support, with a $0.1900 price target on the bears’ radar. As of the time of posting the Relative Strength Index (RSI) on the short-term frame has now shifted slightly around the midline (50.0), backing sideways trading.
Note: Kryptomoney.com is not a financial advisor. Do your research before investing your funds in any financial asset or presented product or event. We are not responsible for your investing results
Image Credit: Shutterstock


Keep in mind that we may receive commissions when you click our links and make purchases. However, this does not impact our reviews and comparisons. We try our best to keep things fair and balanced, in order to help you make the best choice for you.
