The cryptocurrency market slumped on Thursday and in the early hours of Friday, BTC retested the levels below $30k before a slight rebound. The rest of the market is still painted red apart from some selected tokens such as Tezos (XTZ) which ignored the bearish wave to post double-digit gains. Amid the crypto market slump, XTZ/USD upswings to $3.07 intraday high, gaining 19.52% on the day. Tezos tumbled in tandem with the rest of the market on Thursday and early hours of Friday to resume the uptrend from the support at $2.42. At the time of writing, Tezos is exchanging hands at $2.97, gaining 8.67% on a 7-day basis. The asset is currently 19th on the Coinmarketcap table, with a market cap of $2.19 billion, and $648 million in trade volume over the past 24 hours. In late December 2020, Tezos announced the launch of the first NFT platform Kalamint, while releasing a beta version. Kalamint will allow users to create, buy, and sell NFTs (non-fungible tokens). Tezos Kalamint mainnet launch is expected to run in January 2021.
*Amid crypto market slump, XTZ/USD upswings to $3.07 intraday high, gaining 19.52% on the day
*Tezos is exchanging hands at $2.97, gaining 8.67% on a 7-day basis
*Tezos Kalamint mainnet launch is expected to run in January 2021
Key Levels
Resistance Levels: $4.49, $3.90, $3.22
Support Levels: $2.25, $2.22, $2.00
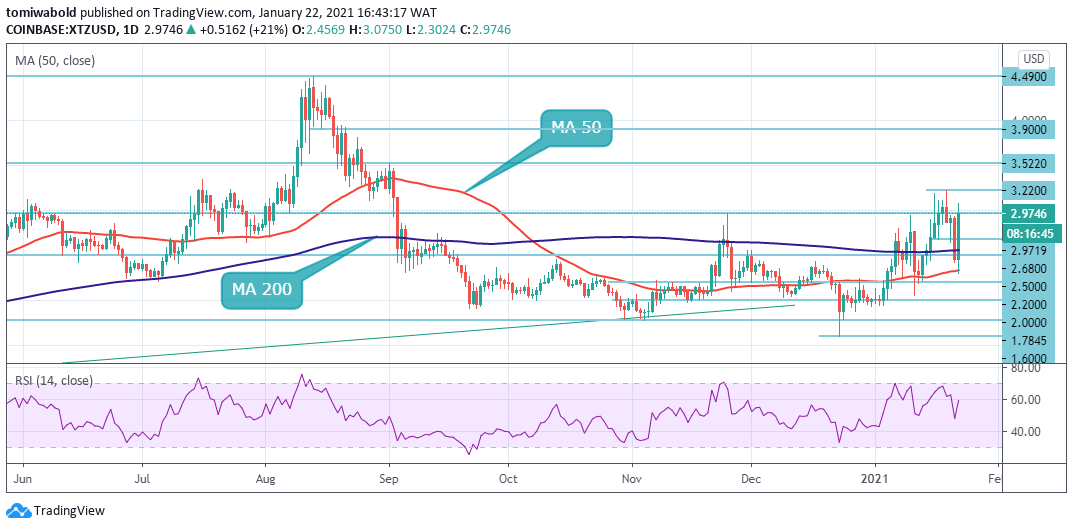 XTZ/USD Daily Chart
Despite a few brief spikes, Tezos is yet to attain it’s August 13, 2020 high of $4.49 with XTZ price constrained beneath the daily MA 50 and 200. Although Tezos has reclaimed the two daily MA levels, the bulls are working assiduously in a bid to drive XTZ past the January 2021 high of $3.22.
A sustained break past this resistance level is crucial to an uptrend with a target objective of $3.90 and then $4.49. On the contrary, if the price turns south from current levels, the first support is envisaged at the MA 200 at $2.55. XTZ bullish view will be negated if the token drops and breaks below the MA 50 at $2.34. Declines to $2.00 and $1.60 are likely in this scenario.
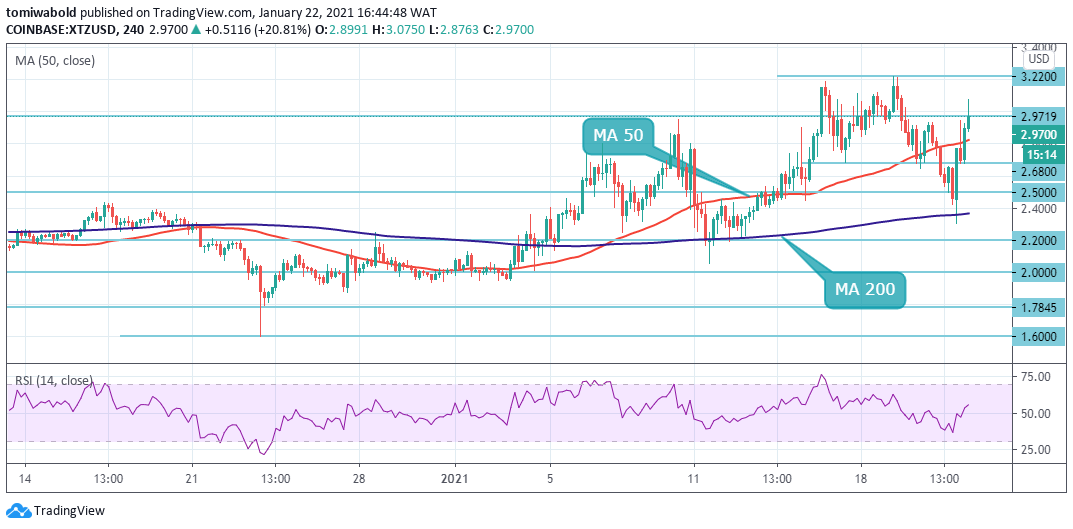 XTZ/USD 4-Hour Chart
On the 4-hour chart, Tezos broke several key resistance levels to trade upwards. The first major resistance above the current price sits above $3.22. A breakout past this barrier can drive Tezos price to a high of $4.4 before a potential run to $5.
On the flip side, the bears may need to claim the MA 50 and 200 located at $2.82 and $2.36 to confirm a bearish comeback. The XTZ/USD pair is only bullish while trading above the $2.68 level, key resistance is found at the $3.22 and the $3.52 levels. If the XTZ/USD pair trades below the $2.36 mark, sellers may test the $2.20 and $2.0 levels.
Note: Kryptomoney.com is not a financial advisor. Do your research before investing your funds in any financial asset or presented product or event. We are not responsible for your investing results
Image Credit: Shutterstock


Keep in mind that we may receive commissions when you click our links and make purchases. However, this does not impact our reviews and comparisons. We try our best to keep things fair and balanced, in order to help you make the best choice for you.