Massive Altcoin price spikes typically occur when Bitcoin remains stable. Tezos registered an outstanding bull run after the market implosion in March which saw its prices skyrocket. Within the present market day, the token of the smart contract increased from a low of $2.72 to an intraday high of $3.16. With a total market cap of $2.2 billion and an estimated daily trading volume of $370 million, XTZ stands at 13th position on the global crypto-currency index. The coin has risen nearly 15 percent at the time of writing in the last 24 hours while exchanging at $3.00. After a short technical correction to $2.21, this cryptocurrency has been in a run as the bullish scenario reinforces a fresh ATH on XTZ/USD. Many alternative coins register massive price spikes over new Altseason indication. As a side benefit, the supremacy of Bitcoin has diminished by 2 percent. Bitcoin continues to rise in correlation with stock market performance. On the flip side, its relative market share is shrinking, underlining the ongoing boom in Altcoins.
*The coin has risen nearly 15 percent at the time of writing in the last 24 hours while exchanging at $3.00
*After a short technical correction to $2.21, this cryptocurrency has been in a run as the bullish scenario reinforces a fresh ATH on XTZ/USD
*Many alternative coins register massive price spikes over new Altseason indication
Key Levels
Resistance Levels: $3.50, $3.33, $3.12
Support Levels: $2.85, $2.50, $2.26
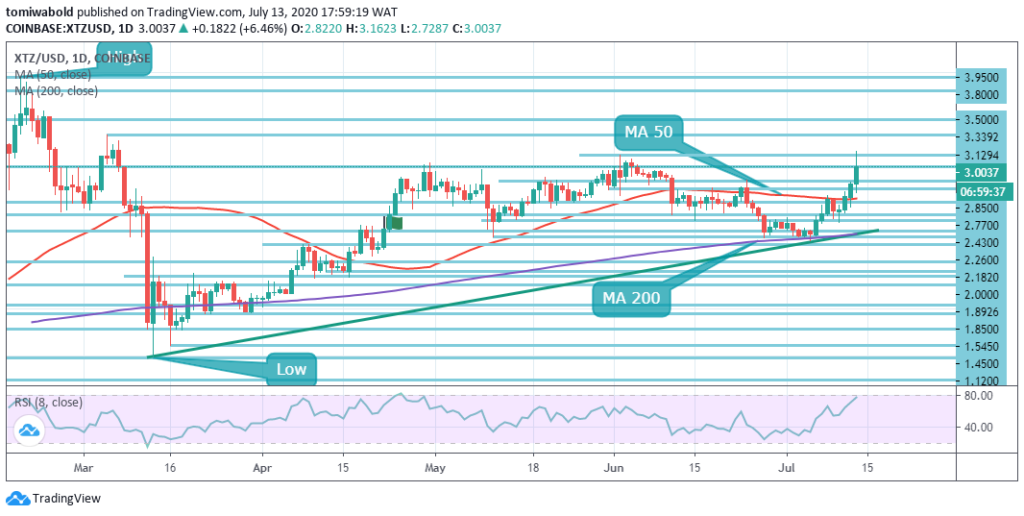 XTZ/USD Daily Chart
 With the new recent pump, both Tezos’ MAs have formed a straight line that provides good support on the MA 50 and MA 200 respectively around $2.66 and $2.26. There’s not much in terms of resistance until the level of $3.50 which may be breached over the next few sessions.
Continuous push beyond $3.00 today reinforced the technical context and enabled it to gain traction from the upside momentum. The next bullish goal arrives at $3.33, which is the highest level since March 2020; nevertheless, before it gets that high, the price needs to clear $3.16 (intraday high).
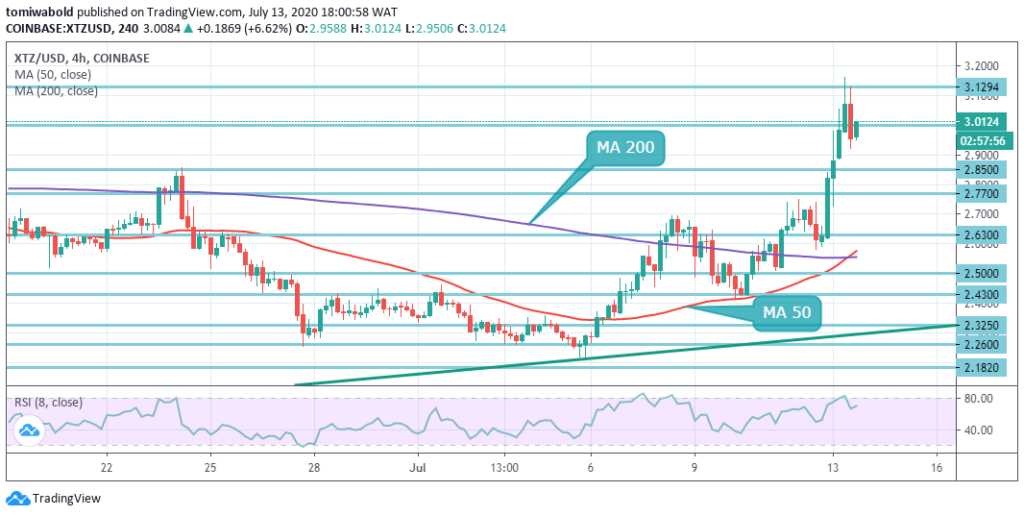 XTZ/USD 4-Hour Chart
The initial support is provided on the intraday charts around $2.85, which is the preceding congestion region and a leap-off area for the bullish push. Once it’s out of the path, the sell-off may probably build traction with the next emphasis on horizontal support levels of $2.77 and $2.63.
On the positive side, the upside requires continuous push beyond $3.00 to gain traction. The latest short-term uptick is prone to incur minimal resistance at $3.12 while increasing in the following hours to $3.33. In the meantime, the trend appears very strong, so expect prices to continue moving forward. Until its near all-time highs where there might be a price correction.
Note: Kryptomoney.com is not a financial advisor. Do your research before investing your funds in any financial asset or presented product or event. We are not responsible for your investing results
Image Credit: Shutterstock


Keep in mind that we may receive commissions when you click our links and make purchases. However, this does not impact our reviews and comparisons. We try our best to keep things fair and balanced, in order to help you make the best choice for you.