The cryptocurrency market is still recovering from Tuesday’s ”flash crash”. Tezos (XTZ), a self-amending cryptographic ledger is posting a nice rebound, up almost 67% from crash lows of $3.90. At the time of writing, Tezos was exchanging hands at $6.00, up 37.90% in the last 24 hours and 15.23% weekly. Ranking 31st, Tezos has a present market cap of $5.26 billion, and $1.72 billion in trade volume over the past 24 hours. Multi-platinum recording artist, Doja Cat is bringing digital collectibles to her fans on the Tezos blockchain. one, the music-focused non-fungible token (NFT) platform on the Tezos blockchain, released the initial drop of rapper/singer’s first NFT collection, “Planet Doja,” on Sept. 8. Tezos continues to grow, hitting over 400,000 daily transaction milestones, which is nearly 35% of ETH’s daily transactions on Sept 9.
Key Levels
Resistance Levels: $8.41, $7.67, $7.00
Support Levels: $5.44, $4.51, $3.89
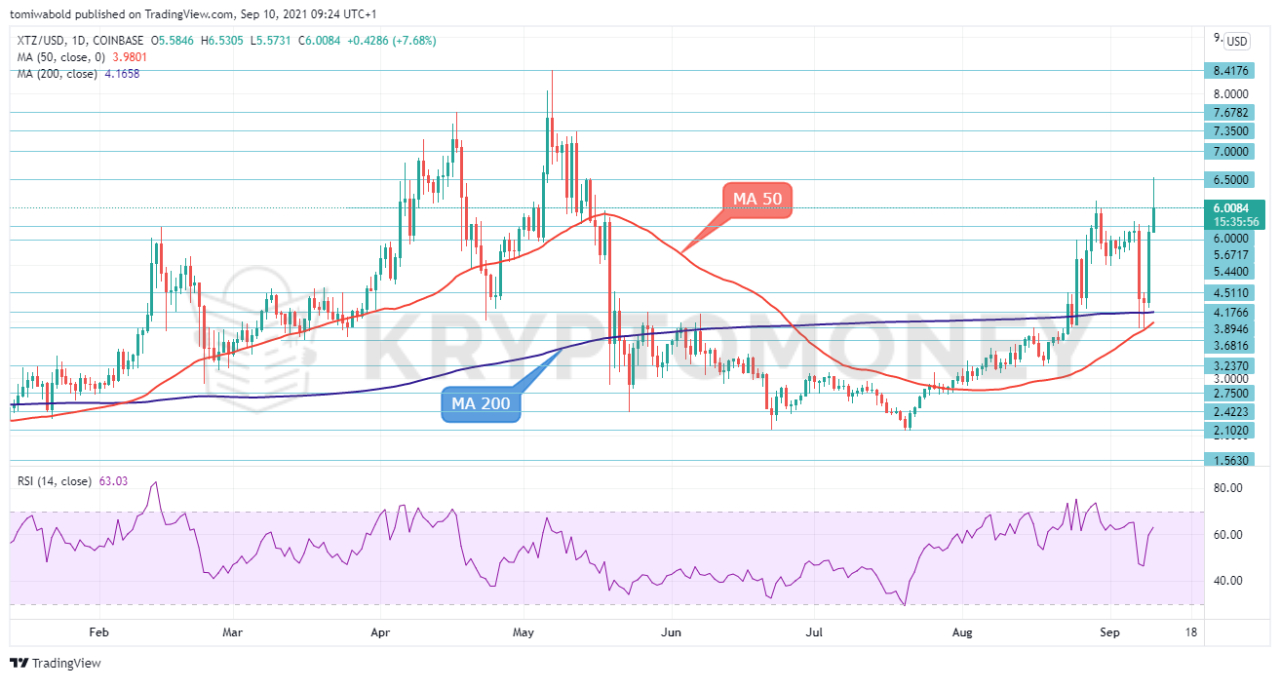 XTZ/USD Daily Chart
Tezos made a sharp recovery following Tuesday’s ”flash crash” with price action on Friday extending the strong rebound. The gains put the XTZ/USD back above late August’s highs of $6.13. Short-term oscillators attest to the current rebound, with the RSI climbing in the positive territory. A continuation to the upside could see today’s high of $6.53 coming in as immediate resistance.
Only a strong breakout above this level could rekindle the upside bias beyond the $7.33 to $7.61 range towards the $8.41 all-time highs. The narrowing distance between the MAs is a key item to watch in the coming sessions. The support levels near the moving averages 50 and 200 (at $3.98 and $4.16 respectively) remain in scope to the downside. A close below these levels could potentially see a bigger decline to as low as $2.10 taking place.
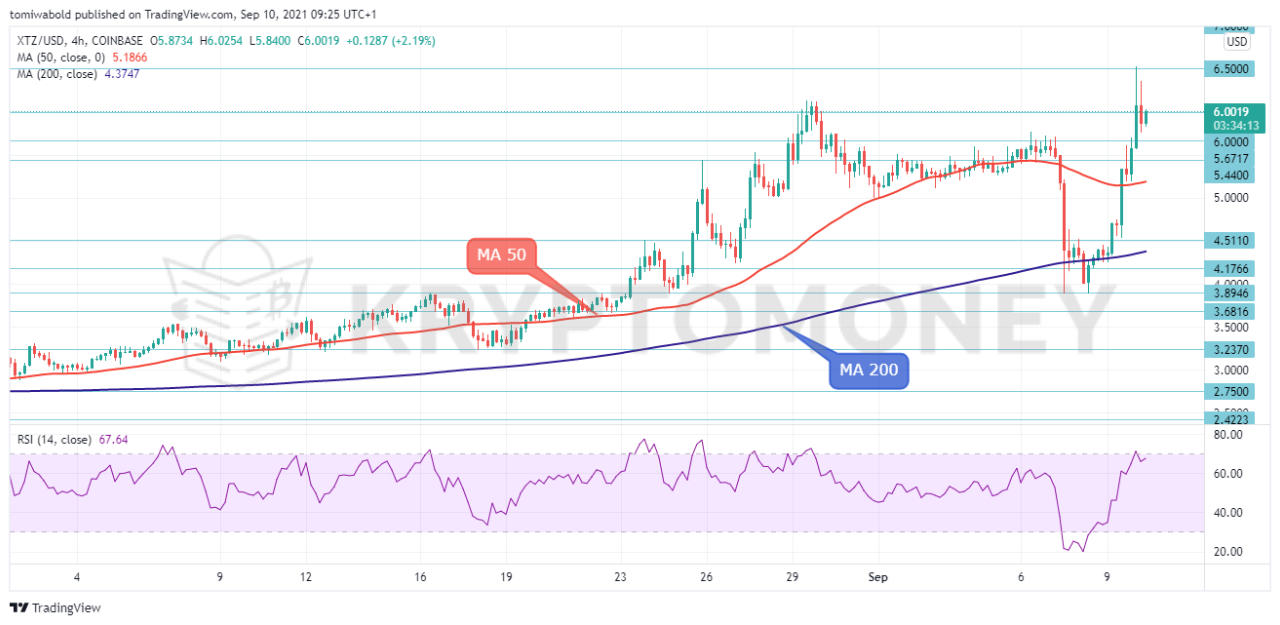 XTZ/USD 4-Hour Chart
After consolidating shortly within the $5.40 to $5.70 range, XTZ price saw a decline on Sept .7, falling below its 4-hour MA 50 and 200 at $5.17 and $4.36 to find support near the $3.90 low from where it subsequently rebounded. Tezos has since recovered to trades above the moving averages. An upside break above the $6.53 high could open the way for the round numbers $7 and $8, setting the stage for a test of the May all-time high of $8.41.
On the flip side, a fresh wave of losses could stall near the $5.77 barrier ahead of the MA 50 at $5.17. A bearish break may seek scope for a test of the MA 200 at $4.36 ahead of the recent low at $3.90. Overall, the price action near the $6.53 high will be critical. On the downside, a decline beneath today’s lows of $5.57 could see the $4.16 level coming into the picture.
Note: Kryptomoney.com is not a financial advisor. Do your research before investing your funds in any financial asset or presented product or event. We are not responsible for your investing results
Image Credit: Shutterstock


Keep in mind that we may receive commissions when you click our links and make purchases. However, this does not impact our reviews and comparisons. We try our best to keep things fair and balanced, in order to help you make the best choice for you.