
Bitcoin’s latest rebound trend is putting it back above $30,000 as bears fade. It remains weak, although it was able to see a short-lived small spike on Friday as markets continued to be rattled by inflation concerns and the Terra UST crash. BTC lost nearly 20% in 7 days and now rebounds nearly 4% at the time of analysis. The broader crypto market capitalization also recovered nearly 6% after its worst day of the year. Bitcoin dominance is currently at 44.39% with plenty of downside potential in all time frames. The recent rebound suggests that BTC/USD has either reached the bottom of the decline at 1 year 5 months low or is on its way to additional losses. Per Glassnode, Bitcoin’s number of addresses sent to exchanges (7d MA) just reached an 11-month high of 6,958.524. Some investors who have held their coins are sending their BTC to exchanges on account of the bearish sentiment. The “exchange inflow,” which monitors the overall amount of Bitcoin traveling to centralized exchange wallets, is the essential signal here. The last time this happened was the previous 11-month high of 6,957.970, observed on December 31st, 2021.
Key Levels
Resistance Levels: $35,000, $33,500, $32,000
Support Levels: $25,000, $22,000, $20,000
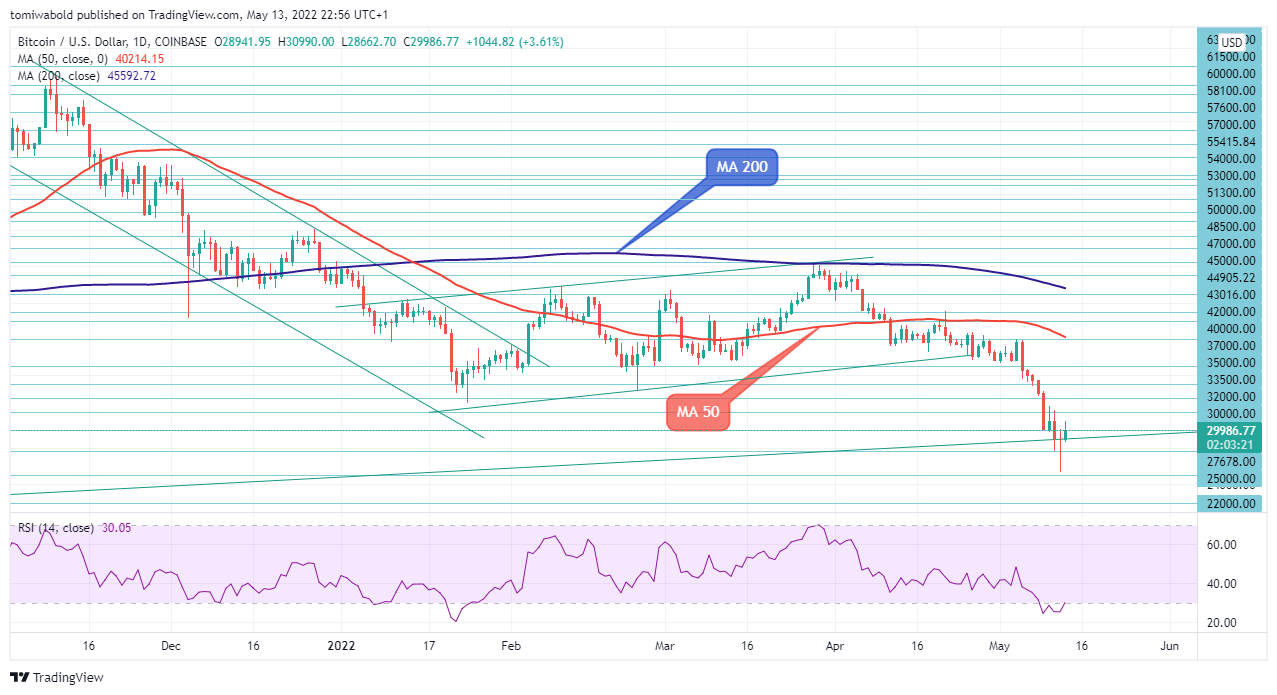
After bears stalled at $25,338 the day before, the BTC/USD gained traction on Friday. A strong break above $32,000 will pave the way for a more substantial rebound and eliminate the current downside risk posed by weak daily momentum.
To allow a more sustainable recovery, additional gains must now exceed this area, as well as the next resistance at $33,500. The surge could continue to the next cluster resistance level of $37,000. It might continue to be the preferred situation as long as the $25,338 low level holds.
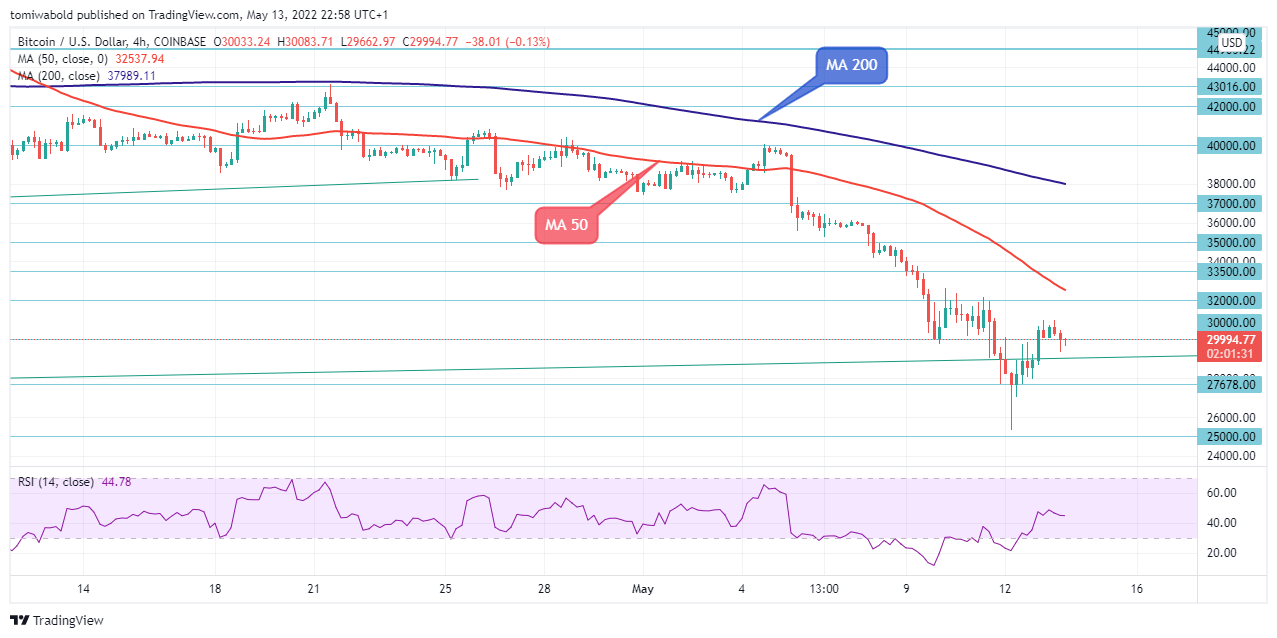
The BTC/USD intraday bias is steady, with the $3,200 support turned resistance level remaining the focus. The majority will argue that the corrective downturn has ended. For the re-test of the $32,000 level, the intraday bias will have to be upward.
The first line of defense was the level of $30,000, which was the last support line breached followed by the level of $25,000, which is now a swing low. The levels of $32,000 and $33,500 are the ones to keep an eye on. The Relative Strength Index, on the other hand, has returned above 40, suggesting that conditions have progressed near the midpoints.
Note: Kryptomoney.com is not a financial advisor. Do your research before investing your funds in any financial asset or presented product or event. We are not responsible for your investing results
Image Credit: Shutterstock


Keep in mind that we may receive commissions when you click our links and make purchases. However, this does not impact our reviews and comparisons. We try our best to keep things fair and balanced, in order to help you make the best choice for you.

