Bulls are making a comeback into the crypto market after a momentary pause. Bitcoin (BTC) broke above the resistance cap at $13,250 to set new yearly highs past $13,600. Cardano (ADA) had a notable slip from its October 20 highs of $0.1244 to lows of $0.098 before bulls defended the price on ADA/USD. A gradual recovery has set in on ADA/USD to $0.11 intraday high. Cardano is the 11th largest cryptocurrency by market capitalization, with $3.24 billion, and its 24 hours average trading volume is presently at $944 million. At the time of writing, ADA/USD is trading at $0.1027, marginally down by 0.35% since the day’s start. Recently, Cardano’s price struggled to gain momentum above $0.1100 but declined sharply. On-chain metrics indicate a massive supply wall holding Cardano back. IntoTheBlock’s “In/Out of the Money Around Price” (IOMAP) model indicates that nearly 20,000 addresses hold more than four billion ADA at the $0.11 resistance barrier.
*Cardano (ADA) had a notable slip from its October 20 highs of $0.1244 to lows of $0.098 before bulls defended the price on ADA/USD
*At the time of writing, ADA/USD is trading at $0.1027 marginally down by 0.35% since the day’s start
*IntoTheBlock’s “In/Out of the Money Around Price” (IOMAP) model indicate that nearly 20,000 addresses hold more than four billion ADA at a $0.11 resistance barrier
Key Levels
Resistance Levels: $0.1510, $0.1298, $0.1150
Support Levels: $0.100, $0.0850, $0.0750
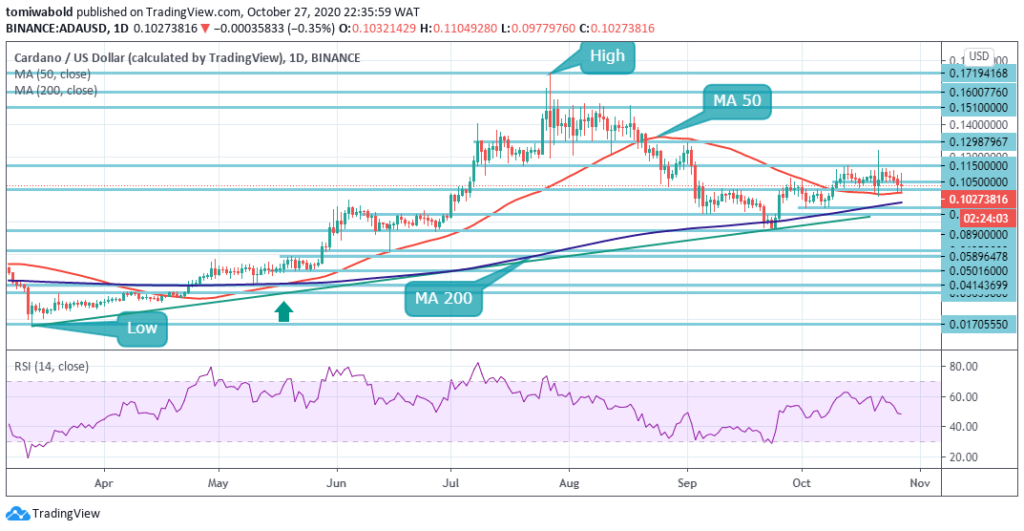 ADA/USD Daily Chart
As seen on the daily chart, bulls are currently defending critical support levels to avoid losing the present upward move. The RSI is presently recovering with a little slit at the midlines. A formidable support point is found where the MA 50 is presently situated at around $0.0980. A rebound from the MA 50 which has already begun can further drive ADA’s price towards the resistance level at $0.1150. A breakout above this point can push Cardano as high as $0.1298.
On the downside, the MA 50 is capable of cushioning any further selling pressure. The price may begin a downward trend if there is a downside breach beneath the MA 50 at $0.098. In this scenario, extra support may be found at the MA 200 zone coinciding with the $0.092 mark.
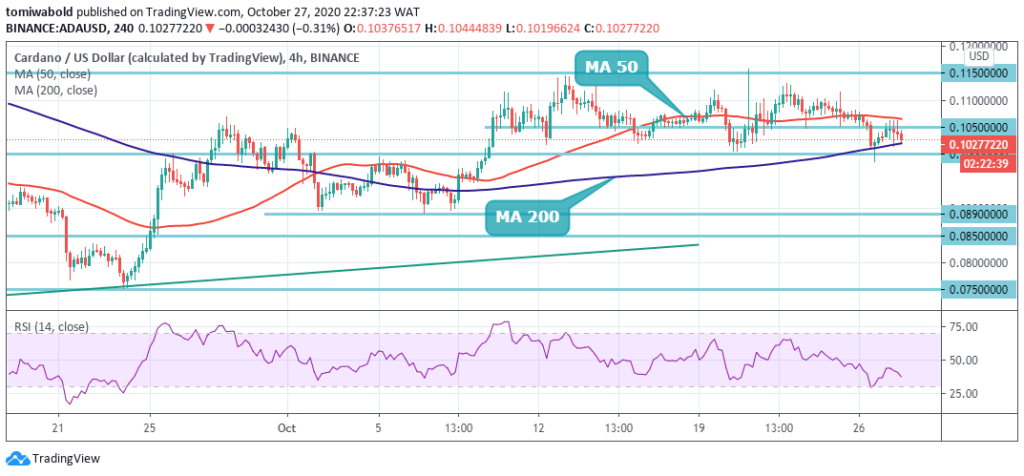 ADA/USD 4-Hour Chart
As observed on the 4-hour chart, bulls are attempting to breach past the MA 50 which has acted as a cap since October 25. ADA must surpass the $0.1085 MA 50 zone and $0.1100 round figure to sustain an upside rally in the near term. For the bulls, their main target will be to flip the $0.1050 from support turned resistance line.
Upon doing that, they should take the price up to $0.1298. Although trading around the $0.1027 mark, the ADA/USD pair is only bullish; the main support is seen at the $0.100 and $0.890 level. If the ADA/USD pair trades beyond $0.1050, the $0.1150 and $0.1298 levels of resistance can be attempted by buyers.
Note: Kryptomoney.com is not a financial advisor. Do your research before investing your funds in any financial asset or presented product or event. We are not responsible for your investing results
Image Credit: Shutterstock


Keep in mind that we may receive commissions when you click our links and make purchases. However, this does not impact our reviews and comparisons. We try our best to keep things fair and balanced, in order to help you make the best choice for you.
