The crypto market is a mixed pattern of red and green. BTC fell to lows beneath $44k after a recent all-time high. Since February’s start, Binance Coin has embarked on a steady uptrend, rising from lows of $41.85 to attain fresh all-time highs on BNB/USD at $150. BNB rally took a new turn on Feb. 8 when it met support at $60.88. At the time of writing, Binance Coin (BNB) is exchanging hands at $126 after retreating from intraday highs of $150. Despite the decline, Binance has gained 20.42% on a daily and 148.32% weekly. Ranking 7th on the Coinmarketcap table, the Binance market cap currently stands at $19.7 billion with more than $7.4 billion in trade volume in the past 24 hours and a present circulating supply of 154 million tokens. In a Feb 10 tweet by CZ_Binance, the CEO stated ‘Today is an important day. #BSC (#BinanceSmartChain) flipped Ethereum on daily transactions’. The sudden rise in BNB price is being attributed to the rise in popularity of the Binance smart chain coming on off Ethereum gas fees spike.
*Since February’s start, Binance Coin has embarked on a steady uptrend, rising from lows of $41.85
*Binance Coin (BNB) is exchanging hands at $130 after retreating from intraday highs of $150
*The sudden rise in BNB price is being attributed to the rise in popularity of the Binance smart chain
Key Levels
Resistance Levels: $165.00, $150.85, $136.66
Support Levels: $100, $75.50, $50.00
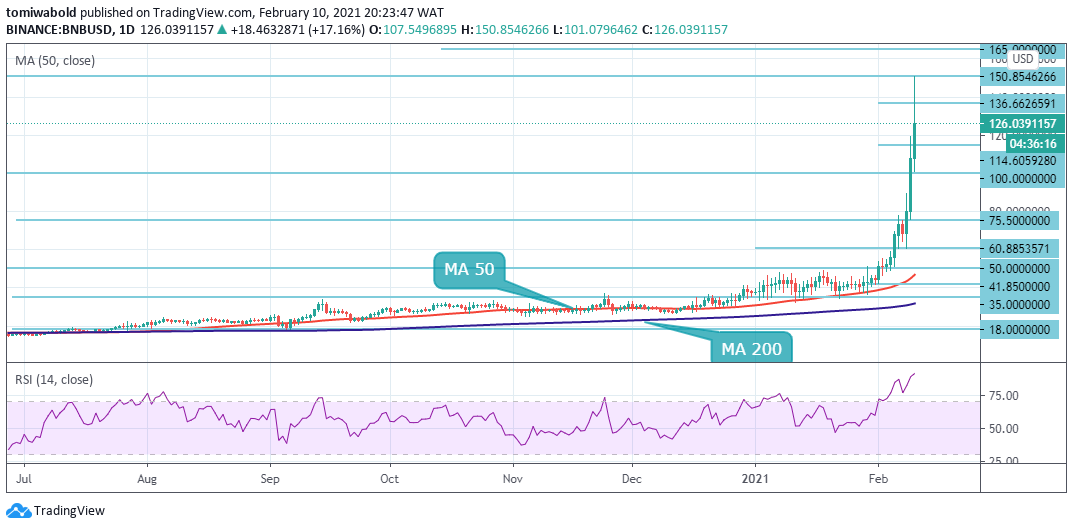 BNB/USD Daily Chart
BNB/USD bulls resumed the uptrend after a shallow correction on Feb. 7. After several resistances flipped, Binance Coin entered price discovery as breakout ensues to new all-time highs of $150. On the upside, a break above $150 holds the key to the continuation of the uptrend. In this case, BNB may eye gains towards $200.
On the flip side, due to the rally occurring in a quick spurt, Binance Coin left several support levels untested. Meanwhile, Binance has found intermediate support at around $120, below where it trades presently. The resistance now turned support at $101 (intraday low) may serve to cushion further losses in case of a downturn.
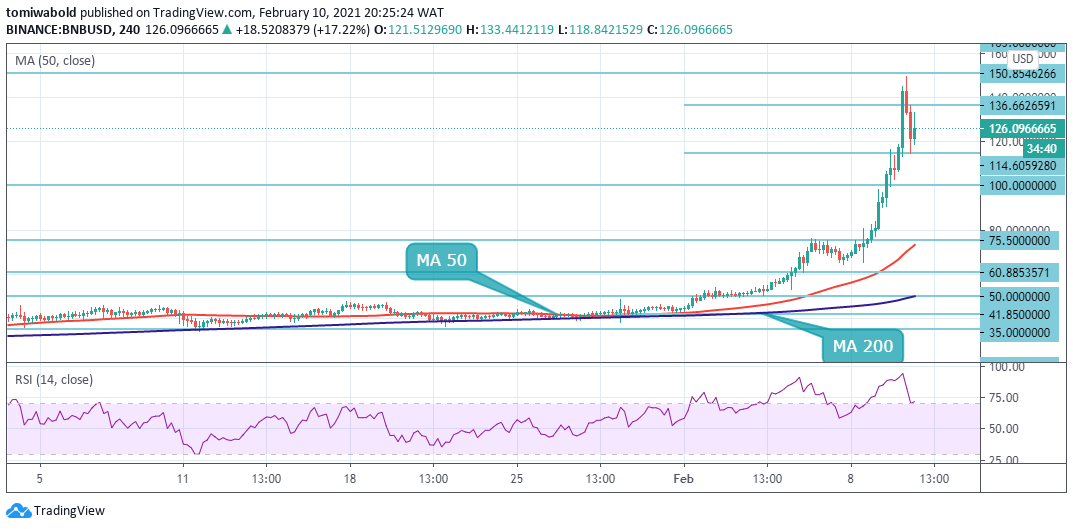 BNB/USD 4-Hour Chart
On the 4-hour chart, BNB bulls defended the support level at $114 after a dip from intraday highs of $150. The bulls are presently attempting to push the Binance Coin price past the confluence zone between $130 and $136 marks. If they succeed, BNB may retest the $150 high and pursue upside gains beyond.
In the alternative, if the price turns down again from the $130 confluence zone, the support at $114 may come to the rescue. If this support fails, BNB may eye decline towards the $100 mark. A breach beneath the MA 50 at $73 may suggest a bearish comeback. The BNB/USD pair is only bullish while trading above $75, key resistance is found at the $136 and $150 levels.
Note: Kryptomoney.com is not a financial advisor. Do your research before investing your funds in any financial asset or presented product or event. We are not responsible for your investing results
Image Credit: Shutterstock


Keep in mind that we may receive commissions when you click our links and make purchases. However, this does not impact our reviews and comparisons. We try our best to keep things fair and balanced, in order to help you make the best choice for you.


