
Binance Coin (BNB) is an exchange-based token developed and issued by the largest volume exchange of crypto-currency, Binance. With an approximate market cap of $2.5 billion, the token ranks 8th in the overall crypto-currency rating. At the time of writing, BNB shifts hands at $16.15, losing 1.37 percent in 24 hours. Recovery is confined on BNB/USD beneath $17 after last week’s remarkable progress ended in losses due to the overall bearish market. CoinMarketCap’s Binance merger took effect on April 2. Irrespective of how Binance seeks to divorce from its recently bought aggregator after a growing suspicion of Binance beneficial effects on the ranking metrics on CoinMarketCap. The suspicion of the crypto-community persists as controlling exchange and a rating platform poses possible questions about conflicts of interest. A high profile transition did occur barely six weeks after its new tenants stepped in: Binance rose to no. 1 on the platform ratings.
*Recovery is confined on BNB/USD beneath $17 after last week’s remarkable progress ended in losses due to the overall bearish market
*At the time of writing, BNB shifts hands at $16.15, losing 1.37 percent in 24 hours
*The suspicion of the crypto-community persists as controlling exchange and a rating platform poses possible questions about conflicts of interest
Key Levels
Resistance Levels: $20.32, $18.9, $17.40
Support Levels: $15.40, $14.50, $14.00
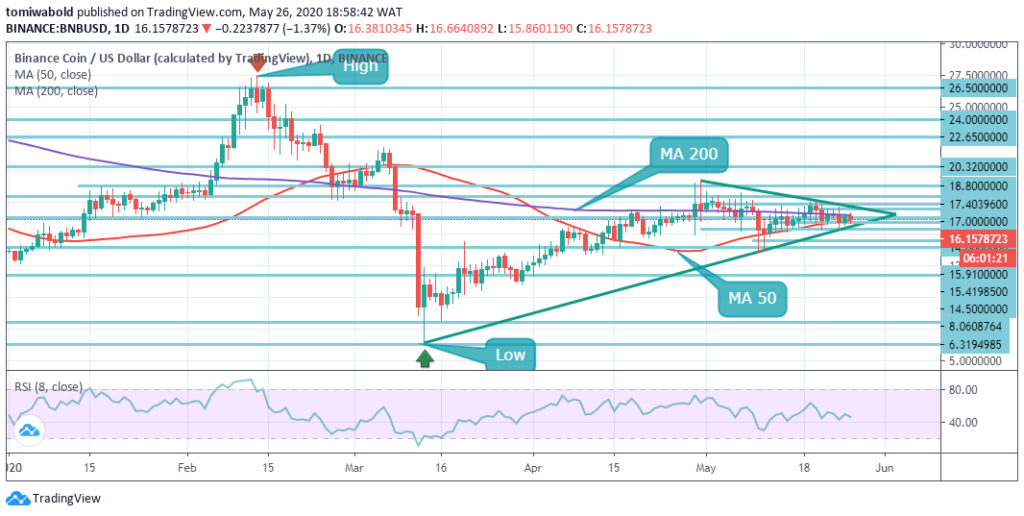 BNB/USD Daily Chart
BNB formed a lower high and a higher low trend this same past week. This established a symmetrical triangle nearby. A breakout beyond the triangle resistance will also grapple with the $17 resistance despite the RSI shift past 50. The volume is growing even though it’s bearish, implying sellers have the advantage. In ensuring the bullish interest holds stable as BNB continues breaching the $20.3 barrier, the RSI must proceed to shift upward to 70.
On the south side, alternatively, the first important horizontal support line is $15.41, supported by $14.50, once the price of Binance Coin drops. The bearish correction is inclined to maintain once it is unable to strengthen this support. However, once BNB discovers solid footing the prices are projected to bounce back strongly.
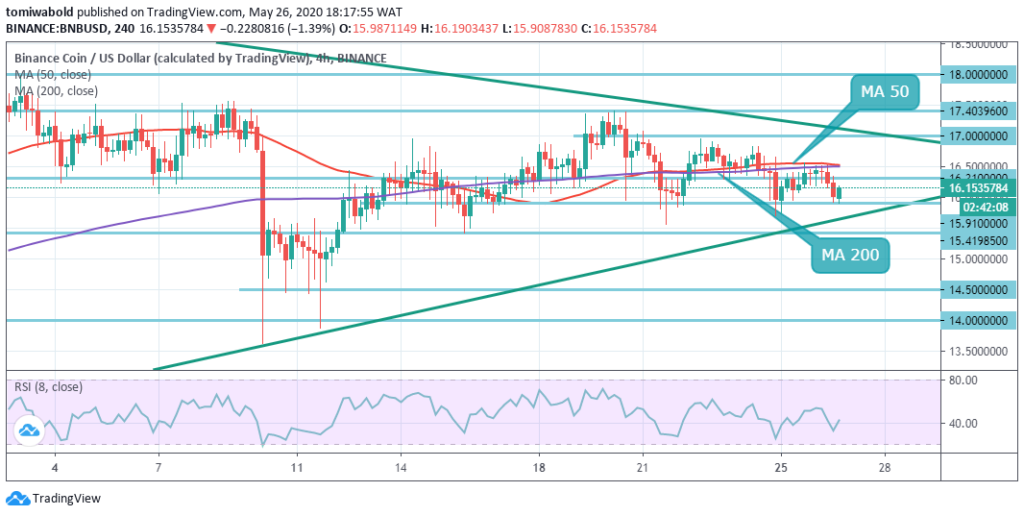 BNB/USD 4-Hour Chart
Glancing at the short-term trend, Binance Coin is consolidating on the 4-hour time frame, as selling pressure briefly picks up with fairly high trading volume. The latest declines tested southside at $15.9, giving room to potential reversal. The initial upside is confined by the initial resistance of $16.3. At the same time, MA 200 and MA 50’s short-term alignment prevents advancement past $16.50.
Currently, the BNB price has surpassed the $16 level, and the gains are being consolidated. When the price falls below the lower boundary of the ascending trendline, this might trigger a bearish ripple and more support could be seen at $14.50, $14.00, and further below.
Note: Kryptomoney.com is not a financial advisor. Do your research before investing your funds in any financial asset or presented product or event. We are not responsible for your investing results
Image Credit: Shutterstock


Keep in mind that we may receive commissions when you click our links and make purchases. However, this does not impact our reviews and comparisons. We try our best to keep things fair and balanced, in order to help you make the best choice for you.
