
A bullish mood has returned to the cryptocurrency market after surviving the recent blow as almost all of the top 10 coins are in green. Meanwhile, Altcoins have been more volatile recently, influenced by the falling dominance rate of Bitcoin (BTC), which has staged a come back at 56.6%. Bitcoin has been in consolidation for over a week now following initial free-fall from highs above $12,000. In spite of being on a decline, Buyers rekindle traction for BTC/USD upside move toward $10,500. The BTC market cap currently stands at $190.39 billion, with $45.36 billion traded in the past 24 hours. Bitcoin is trading at $10,277 at press time. Bitcoin’s hash rate registers fresh all-time high and has broken the 150 TH/s plateau for the very first time. Hashrate is used to measure the health of the Bitcoin network. It represents the amount of global hash power dedicated to mining BTC.
*Bitcoin has been in consolidation for over a week now following initial free-fall from highs above $12,000
*In spite of being on a decline, Buyers rekindle traction for BTC/USD upside move toward $10,500
*Bitcoin’s hash rate registers fresh all-time high and has broken the 150 TH/s plateau for the very first time
Key Level
Resistance Levels: $11,500, $11,000, $10,000
Support Levels: $10,000, $9,500, $9,000
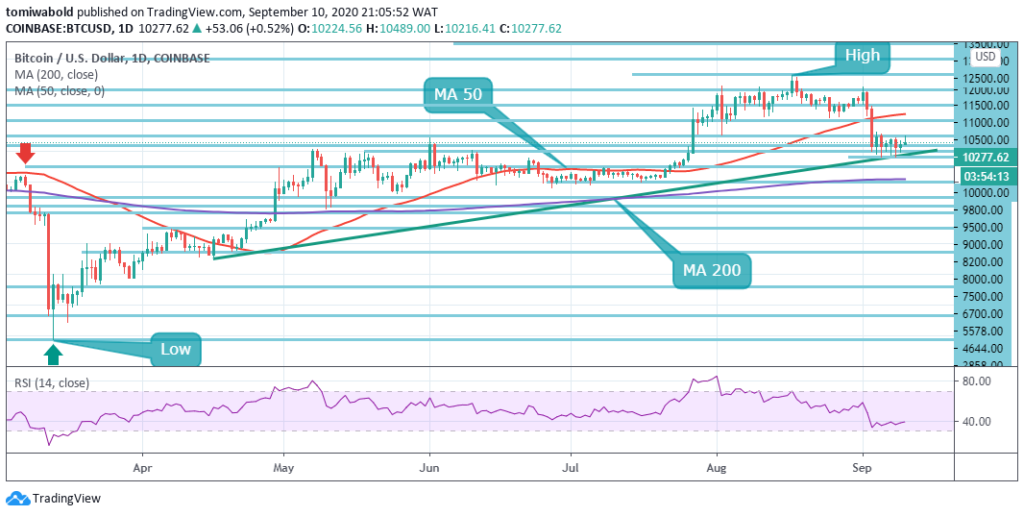 BTC/USD Daily Chart
The price of Bitcoin (BTC) has tended to range around $9,800 and $10,500 for roughly a week after a massive cut from $12,100. However, over the medium to long term, investors anticipate Bitcoin to rebound and view the current consolidation phase as a positive pullback. It aligns at $10,500 at the upper limit of the recent consolidation range.
On the contrary, Bitcoin did a decent job maintaining the key level of support at $10,000, local support comes at $9,500, and then $9,000. The price may retry this supply area before initiating recovery. A continuous decline beneath $9,000 may contradict the bullish projection instantly and raise the likelihood of a larger correction.
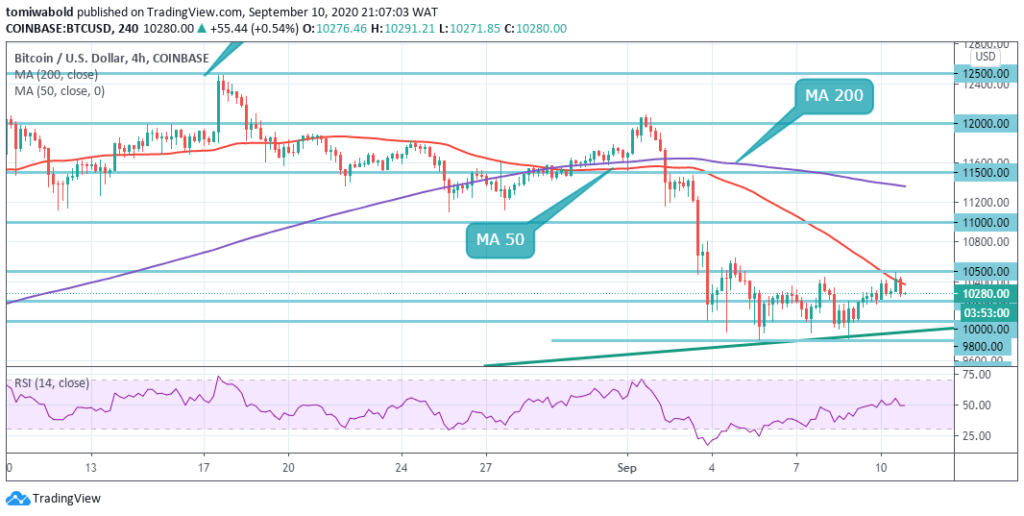 BTC/USD 4-Hour Chart
In the short term, the BTC/USD pair suggests much of consolidation, as sellers struggle to create an intraday low beneath the support level of $10,000. An analysis of the lower time frame indicates that if the BTC/USD pair hits the $10,500 level a bullish reversal trend may begin to take shape. Price consolidation beyond the level of $10,500 might suggest that bulls could be aiming to challenge the level of $11,000 again.
In the meantime, a collapse of the pattern’s lower border and a further decline to the $8,800 stage may not be impossible. The BTC/USD pair is only bullish while exchanging beyond level $10,500, main resistance is seen at level $11,000. If the BTC/USD pair is exchanging under $10,500, sellers may test the $10,000 and $9,500 level.
Note: Kryptomoney.com is not a financial advisor. Do your research before investing your funds in any financial asset or presented product or event. We are not responsible for your investing results
Image Credit: Shutterstock


Keep in mind that we may receive commissions when you click our links and make purchases. However, this does not impact our reviews and comparisons. We try our best to keep things fair and balanced, in order to help you make the best choice for you.


