
Ethereum price caught hold of the path of market capitalization’s leading cryptocurrency, Bitcoin. Ethereum (ETH) price is increasing by a whopping 7.5 percent in 24 hours hitting an intra-day peak of $238, with a market cap of $25.9 billion. ETH/USD extended the bullish phase beyond the high of Friday at $225 past the pivotal level of $230. On Saturday Ethereum (ETH/USD) gained traction and advanced to its highest level since March. The pair is rising in value at $237 at the time of publishing. Ethereum is now growing more than 16 percent since the outset of the week with this latest upsurge. Interest amongst investors in the Ethereum options has never been higher. Skew analytics revealed that Ethereum option contracts on leading derivatives exchange Deribit has hit a fresh all-time high of open interest over $108 million. The above suggests that over the next few months more investors may be hedging their bets as it relates to Ethereum’s price.
*Ethereum (ETH) price is increasing by a whopping 7.5 percent in 24 hours hitting an intra-day peak of $238
*ETH/USD extended the bullish phase beyond the high of Friday at $225 past the pivotal level of $230
*Skew analytics revealed that Ethereum option contracts on leading derivatives exchange Deribit has hit a fresh all-time high of open interest over $108 million
Key Levels
Resistance Levels: $266, $250, $240
Support levels:$220, $206, $190
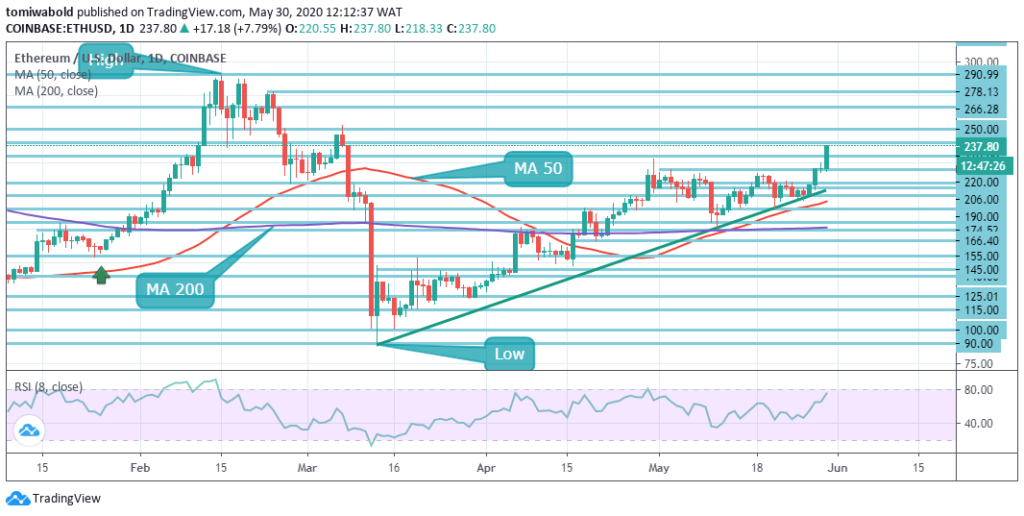 ETH/USD Daily Chart
The daily chart’s Relative Strength Index (RSI) indicator is anticipating 80, indicating that Ethereum may hesitate to sustain its bullish traction and trigger a technical reversal in the near-term once it reaches the overbought mark. However, as long as it ends the week beyond $230, ETH/USD may probably stay bullish.
A constant resistance overlaps beyond the level at $240 besides $250 range (psychological level / high Feb 27). At the other side of the coin, preceding $206 (ascending trendline peak), and $200 (psychological level), $220 (daily low) may be seen as initial technical support. While the distance between MA 200 as well as MA 50 widened, buyers steadily increased holding their positions. Certain technical metrics including the pattern of the candle holds for optimistic traction.
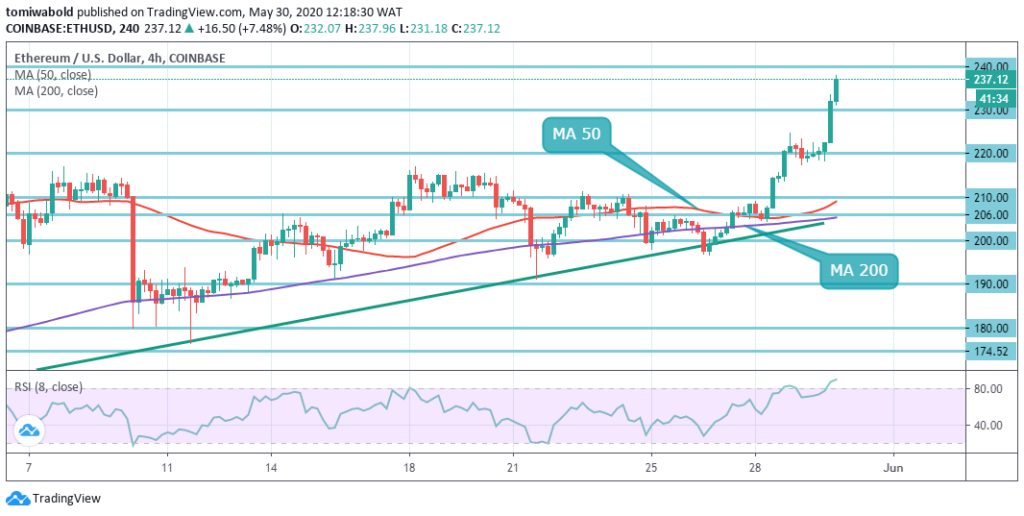 ETH/USD 4-Hour Chart
Ethereum is attempting to rally back to the monthly high of March levels, even as the second-largest cryptocurrency accelerates beyond the $230.00 mark. On the 4-hour time frame, however, the RSI is overbought and a short-term reversal may be set in for the pair. The resistance levels of $240.00 and $250.00 are the main upward targets at which ETH/USD bulls focus. Continued increases in the BTC/USD pair towards the $10,000 mark for the Ethereum is first deemed positive because of its strong correlation.
The ETH/USD pair is only bullish whilst exchanging beyond the level of $220.00, the main resistance is seen at levels around $240.00 and $250.00. Once the ETH/USD pair sells underneath the $220.00, sellers are allowed to test the support levels of $190.00 and $174.52. Once the analytical context improves or remains the same, there is a chance that Ethereum may exit the week beyond $230 and shift the focus to $250.
Note: Kryptomoney.com is not a financial advisor. Do your research before investing your funds in any financial asset or presented product or event. We are not responsible for your investing results
Image Credit: Shutterstock


Keep in mind that we may receive commissions when you click our links and make purchases. However, this does not impact our reviews and comparisons. We try our best to keep things fair and balanced, in order to help you make the best choice for you.


