
The overall crypto market has been trending lower ever since the China crypto crackdown resulting in negative sentiment and unwinding of bullish positions that had been accumulated before. Ethereum is still trading in the red for the week after it plunged from a high of $2,275 on Sunday to a low of $1,700 as of Tuesday. Despite a strong technical bounce to $2,045, the ETH/USD reverts slight increases beneath the $2,000 key zone. At the time of this post, ETH/USD is undergoing an intraday drop from its daily high of $1,851 towards the swing low at the $1,700 level. On Friday, June 25, Ether faced its largest options expiry in 2021, when more than $1.5 billion in open interest was settled, keeping Ether down. Ethereum supply has been continuously increasing across all exchanges, indicating that investors may have anticipated a sell-off.
Key Levels
Resistance Levels: $3,000, $2,550, $2,000
Support Levels: $1,700, $1,300, $900
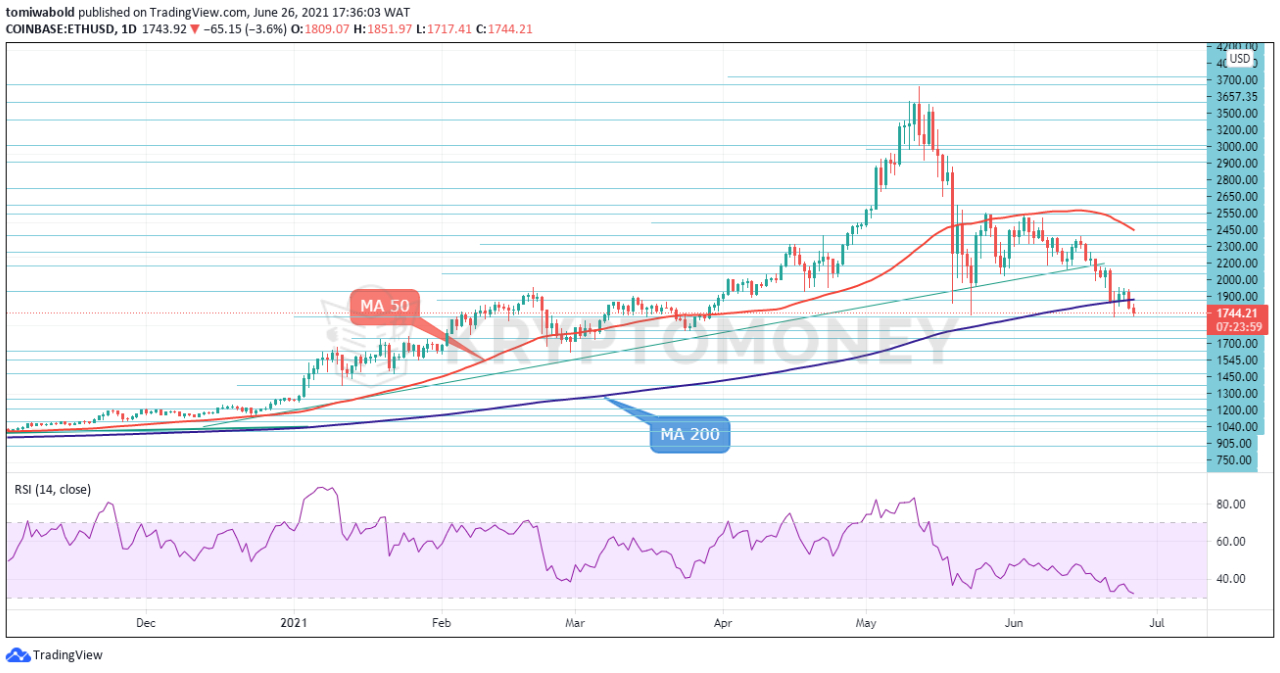 ETH/USD Daily Chart
Ethereum price recovered off the moving average (MA 200) on the daily chart after plunging to $1,700 low during Tuesday’s trading, but momentum has waned for a further move higher, according to technical indicators. The RSI indicator is flattening out in the negative zone, and price trades beneath the MA’s 50 and 200. When looking at the big picture, it’s evident that the pair may soon return higher.
If the price continues to fall, the focus will shift to the downside, towards the March 25 low of $1,545, which, if surpassed, will enhance downside pressure and result in a complete trend reversal. However, there is potential to challenge the $2,000 key zone if price movement maintains above the MA 200 line. If this important level is broken, the market will continue to rise towards $2,640, the high from June 15.
 ETH/USD 4-Hour Chart
On the lower time frame, Ether’s price has been trading within a downward sloping channel over the last 6 weeks, after the market reached the record high of $4,384. Currently, the rebound off the $1,700 support is not helping the second-largest crypto to hold within the channel and around the short-term moving averages. Overcoming these obstacles would see the price towards the key resistance at $2,550.
From the technical perspective, the moving average (MA 50) is heading south, following the bearish cross within the 4-hour chart on May 23, while the RSI is pointing down near the downward threshold of 30. In the positive scenario, a successful rebound beyond the $1,500-$1,700 region could be crucial for the bulls. The no. 2 crypto is negative in the very short-term, however, the bounce off $1,700 is still in place in the broader outlook.
Note: Kryptomoney.com is not a financial advisor. Do your research before investing your funds in any financial asset or presented product or event. We are not responsible for your investing results
Image Credit: Shutterstock


Keep in mind that we may receive commissions when you click our links and make purchases. However, this does not impact our reviews and comparisons. We try our best to keep things fair and balanced, in order to help you make the best choice for you.

