
According to data from CoinMarketCap, at the time of publication, the price of Ether was $1,644, a loss of 1.53% from the previous day. Blockchain scaling system developer StarkWare recently announced its intentions to make its main cryptographic software product open source. StarkWare addresses Ethereum’s scalability problems, which result in low throughput and expensive gas or transaction costs. The company offers two platforms: the StarkEx scaling engine and StarkNet, which equip programmers with the necessary technology to create decentralized applications. The STARK Prover technology that underpins those projects will be made available as open source by StarkWare. Wu Blockchain reports that on February 2. The burning quantity of Ethereum surpassed 3040, establishing a new high since November 10 last year. Uniswap and OpenSea serve as the primary burning sources.
Key Levels
Resistance Levels: $2,300, $2,000, $1,700
Support Levels: $1,500, $1,300, $1,000
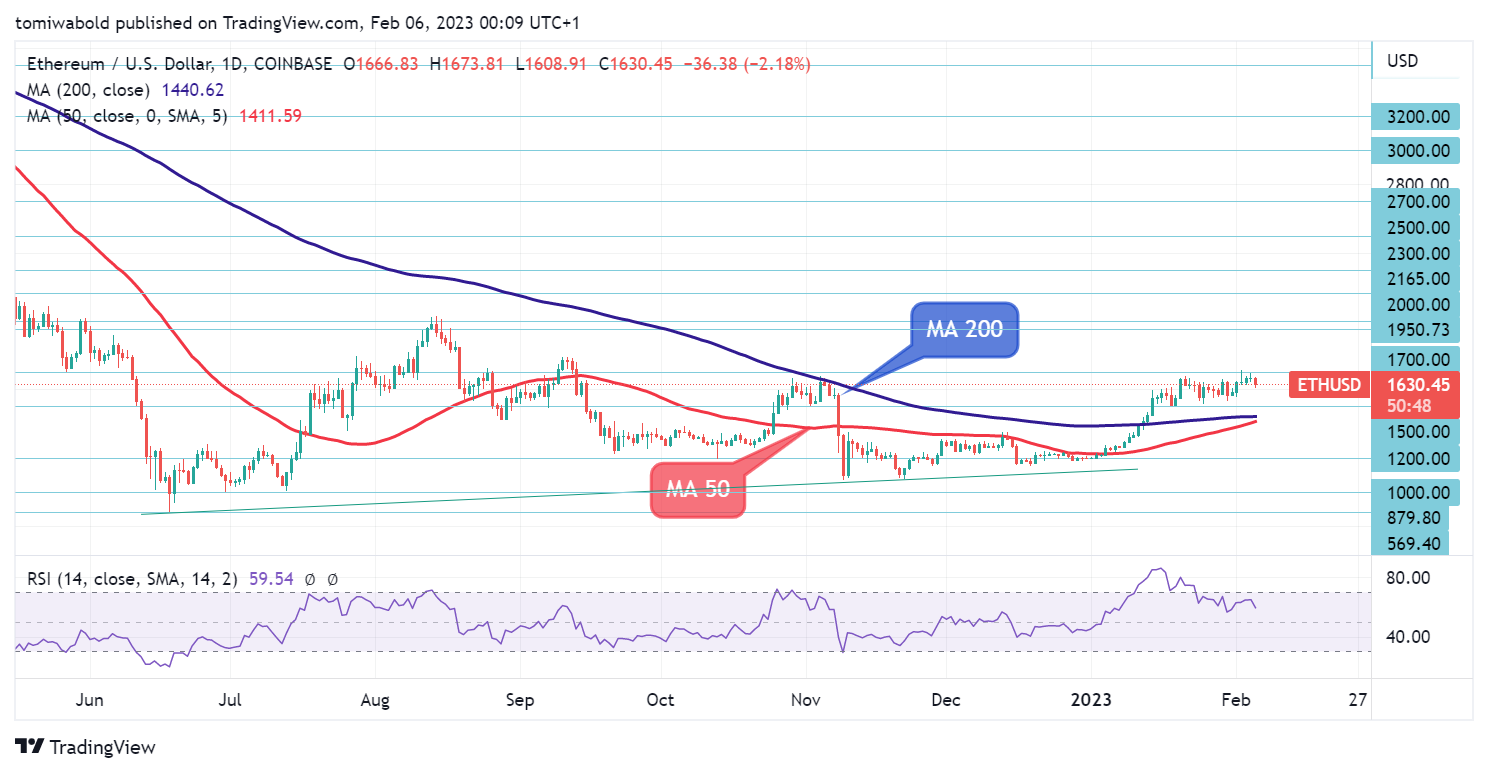 ETH/USD Daily Chart
Amid today’s decline, the direction for Ethereum (ETH) in the near term is still range-bound. Support for ETH/USD is at $1,500, while the upside barrier is at $1,700. As long as these levels hold, the next committed move in ETH is more likely to be upward than downward. If it dropped still more, it may also reach the following significant support area between $1,300 and $1,200.
The bottom end of the range should receive strong support from these zones in the future as it settles and consolidates. If gains above $1,500 are maintained, the ETH/USD pair should move past the $1,700 mark. Once the pair breaks out, bulls are expected to push it higher, with their sights set on the next resistance level of $2,000, However, there is a small chance.
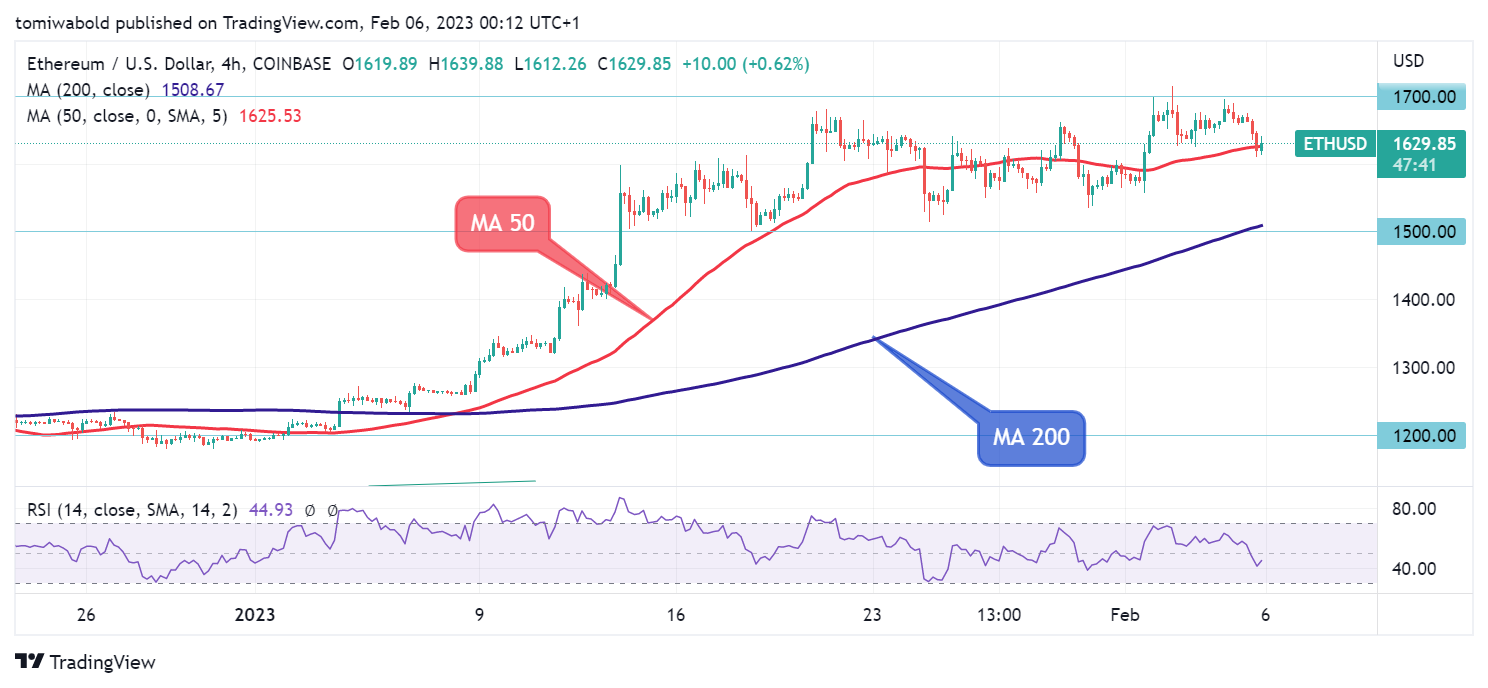 ETH/USD 4-Hour Chart
At the time of writing, the ETH/USD pair is trading below yesterday’s low of $1,645. On the four-hour chart, the pair is barely above the moving average (MA 50). It’s also nearing a retracement level, and the Relative Strength Index (RSI) is forming a bullish pattern and seeking to return above its midline. Bulls are aiming for the next resistance level of $1,700 as the pair is projected to break out higher.
If the $1,700 barrier is not breached, the ETH/USD pair may go below the 50-day moving average (MA) and the $1,608 support region intraday. Only when the ETH/USD pair is trading over $1,700 is it considered bullish; important resistance levels are $1,700 and $2,000. If sellers are willing to test $1,500, the pair could fall back to $1,300.
Note: Kryptomoney.com is not a financial advisor. Do your research before investing your funds in any financial asset or presented product or event. We are not responsible for your investing results
Image Credit: Shutterstock


Keep in mind that we may receive commissions when you click our links and make purchases. However, this does not impact our reviews and comparisons. We try our best to keep things fair and balanced, in order to help you make the best choice for you.