A short-term bounce may have begun on the cryptocurrency market as the majority of the Altcoins are in green. The technical trading side of the market is currently reflecting the general mood of the landscape as BTC remains the barometer for the ecosystem trend. VET/USD surges higher for the 9th day in a row after its rebound from the MA 50 on Feb. 27. The buying pressure is increasing in intensity and gains are likely to continue. The token is now on track as the VET/USD price snowballs past the double top around $0.063. VeChain (VET) has recovered strongly after a drop to a low of $0.0340. However, the market cap is still the 21st largest, at $3.8 billion, with $755.9 million in trading volume over the past 24 hours. VET is dancing at $0.0621 at the time of writing after reaching intraday’s high at $0.0647. VeChain price has been forming a series of higher highs and higher lows up from the $0.0115 low level. Supporting a continuation of this bull cycle is VET’s price staying beyond the MA 50 since Dec. 27, 2020. VeChain has extensive experience delivering blockchain applications to a variety of industries.
*VET/USD surges higher for the 9th day in a row after it rebounds from the MA 50 on Feb. 27
*The token is now on track as VET/USD price snowballs past the double top around $0.063
*Supporting a continuation of this bull cycle is VET’s price staying beyond the MA 50 since Dec. 27, 2020
Key Levels
Resistance Levels: $0.075, $0.070, $0.065
Support Levels: $0.060, $0.055, $0.050
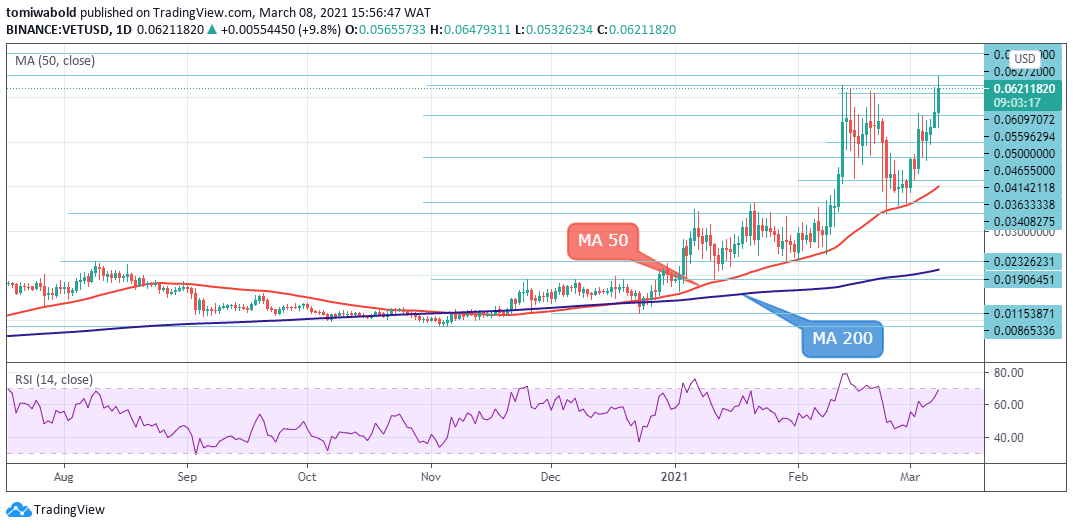 VET/USD Daily Chart
VeChain upside run continues with gains reaching the $0.065 high in the wake of a technical breakout from the double top at $0.063. The pair lifted from the $0.0458 of Mar. 5 low level followed by 4 days of a bullish run. This technical formation has a bullish bias which may increase the buying pressure.
However, if the selling pressure returns on the pair, VeChain will cancel the rally and begin to search for another formidable support. Expected dips may provide better opportunities to re-join the bullish market around the support level at $0.0456 and rising MA 50 at $0.040 is expected to contain and keep bulls intact.
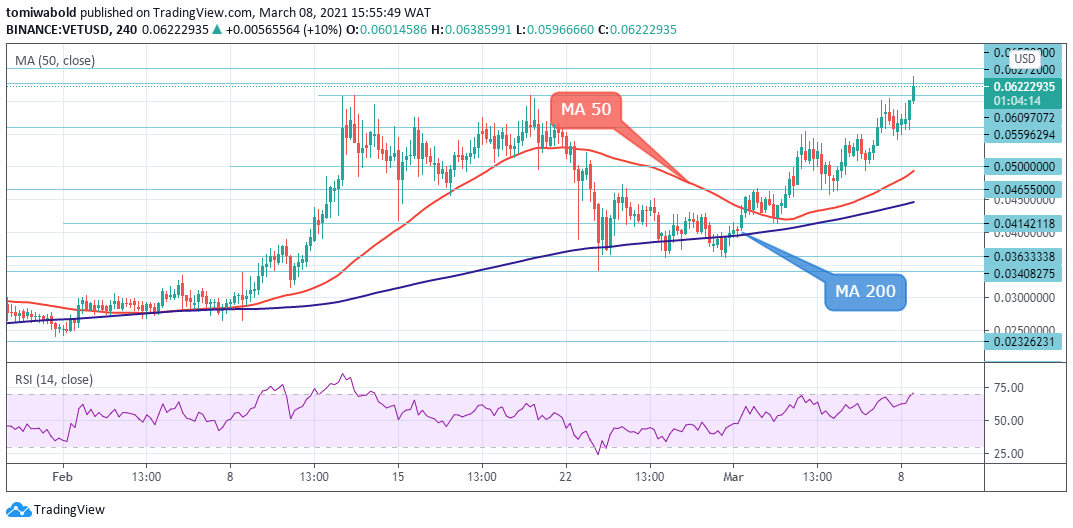 VET/USD 4-Hour Chart
VET/USD has recovered above the prior highs at $0.0609 level lifting from the 4 hour MA 50. VET could be rallying on the notion that traders will be investing in VeChain as its use-case increases. The short time frame shows that the $0.065 resistance level is a possible barrier for the VET/USD.
The trend remains heavily bullish; however, opportune traders can look for highly probable counter-trend trades. Trading beneath the near-term liftoff level at $0.0559 could provoke a sell-off towards the MA 50 at the $0.050 level. The VET/USD pair is only bullish while trading above the $0.0456 level, If the VET/USD pair trades below the $0.0456 level, sellers may test the $0.0414 and $0.0363 levels.
Note: Kryptomoney.com is not a financial advisor. Do your research before investing your funds in any financial asset or presented product or event. We are not responsible for your investing results
Image Credit: Shutterstock


Keep in mind that we may receive commissions when you click our links and make purchases. However, this does not impact our reviews and comparisons. We try our best to keep things fair and balanced, in order to help you make the best choice for you.

