Positive expectations rose in the news wake of XRP forming a golden cross on its daily chart recently. The third-largest cryptocurrency with a market cap of $11.3 billion had earlier suffered from the flash crash that affected the cryptocurrency market lately as it wobbled from $0.34 high reached in the past few weeks to as low as $0.255 where it sits at the moment, nose-diving by almost 23%.
Surprisingly, XRP isn’t the first to print a golden cross this year, Bitcoin, Cardano, and EOS had formed golden cross earlier this year. Bitcoin’s golden cross formation was followed by a massive 180% surge.
The golden cross which is a strong bullish indicator happens when a short term simple moving average (50-day) crosses above the long term simple moving average (200-day). It is often bolstered by high trading volumes.
XRP’s golden cross is appearing for the first time in months which makes it quite significant.
XRP had performed below expectations in the past few days as it flunked by nearly 23% in comparison to Bitcoin which only shed 9%. Despite the asset’s dismal performance which was accompanied by fears of a long term weakness, traders are however looking at the brighter side of events as the crypto asset printed a golden cross on the daily chart of its USD pair.
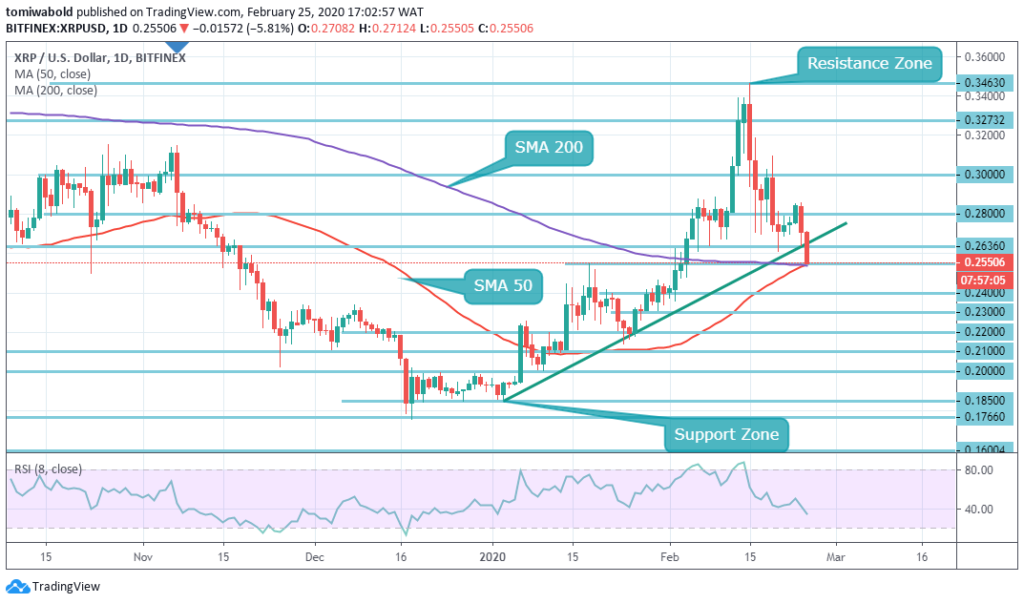 Currently, XRP is trading beneath the breached trend line support; although it has strong support at the 61.8% Fib level that it gained when it fell from $0.3463 to a low of $0.1766 while now trading at $0.255.
Despite the losses it recorded on February 15, when it plunged from the yearly highs of $0.3463, XRP/USD holds firm above the moving averages.
The formation of the golden cross which is a weighty long term bullish indicator could lead up to a strong squeeze above the resistance at $0.28 and $0.30.
A traditional indicator well known as the IchiEMA formed a green candle on its XRP weekly chart. The indicator which predicted its rise in 2017 by 1000% within a month range is flashing green again. During the 2017 event, the indicator had printed the green signal two weeks before, which saw the crypto-asset climb from $0.20 to above $3.00.
In another trend analysis, it is foreseen that the crypto asset will rebound by 200% to 300% in the next few months to reach a price of $1.00. This analysis had forecasted with a measure of accuracy when XRP bottomed its chart at $0.17 and its successive rebound to $0.34.
Image Credit: Shutterstock


Keep in mind that we may receive commissions when you click our links and make purchases. However, this does not impact our reviews and comparisons. We try our best to keep things fair and balanced, in order to help you make the best choice for you.
