Cardano (ADA) is the 15th largest digital asset with a market value of $756,060,506 and one of the tokens making an effort to surge past key barriers against the US dollar with a minimal loss of -2.25 percent in the last 24 hours. At the time of writing, ADA/USD is changing hands at $0.0292, which at present remains nearly constant at the same pace from the beginning of the year. The average volume of daily trading in Cardano is estimated at $85 million. Currently, ADA levels are anticipated to break out of the tight triangle range beyond the $0.0320 level of resistance against the US dollar. IOHK recently announced the launch of the Ouroboros Hydra protocol, offering to help greatly enhance the Cardano network via micropayments on its Dapps.
*Anticipated breakout of triangular range in ADA/USD beyond resistance level of $0.0320
*ADA is making an effort to surge past key barriers against the US dollar
*IOHK announced the launch of the Ouroboros Hydra protocol
Key Levels
Resistance Levels: $0.0517, $0.0400, $0.0320
Support Levels: $0.0260, $0.0170, $0.0150
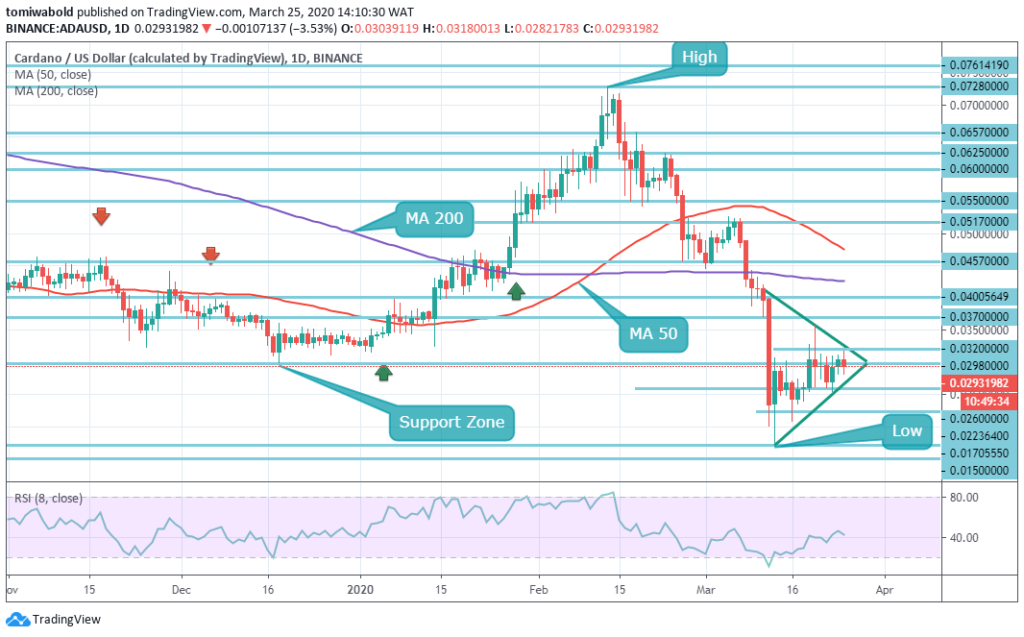
 The pair is initially consolidating in a tight triangle range and moving close to the resistance level of $0.0320. This is attempting the 50 percent retracement level of the recent decline from the high of $0.0357 to the low of $0.0262 levels. There is also a big barrier on the upside, emerging near the level of $0.0370. This corresponds with the retracement level of 76.4 percent of the recent fall from the high of $0.0400 to low of $0.0175 levels.
The chart shows that the ADA price is trying to consolidate underneath the $0.0320 resistance level within a narrow triangle range. If a clear break exceeds $0.0320 level, the price may probably increase rapidly. If it’s the latter, there is a possibility of a sudden fall underneath the level of $0.0260.
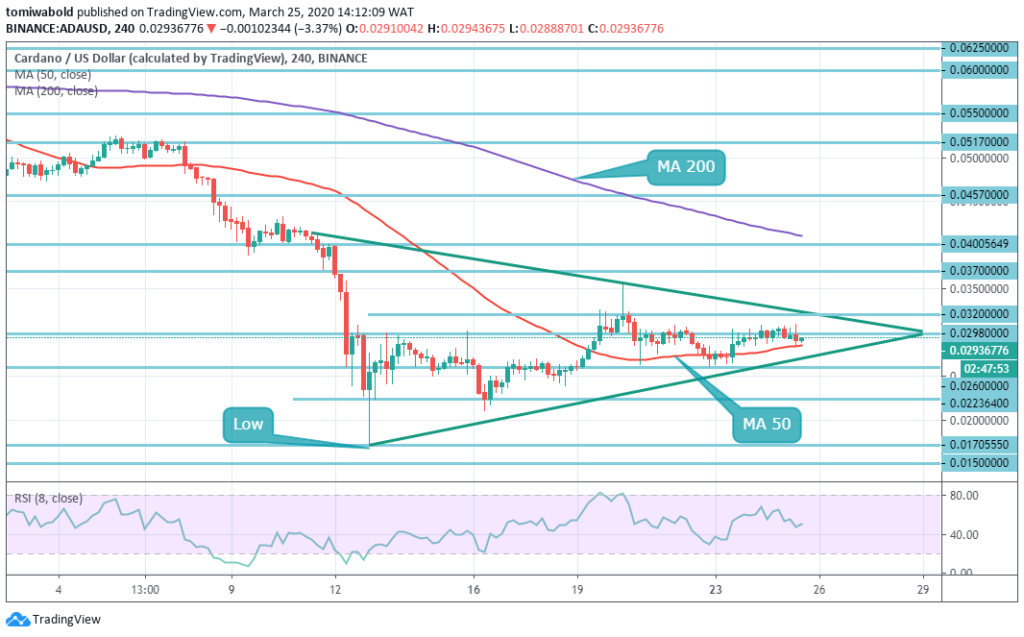
 Immediate resistance on the 4-hour time frame is close to the $0.0298 level. If the price increases beyond the resistance levels of $0.0298 and $0.0320, it may begin a steep rise in the near term. The next big obstacle is close to the level of $0.0370, above which the price is likely to go higher to the level of $0.0400 beyond the triangle’s limit.
Alternatively, the price may struggle to stay beyond the resistance area of $0.0320 level. On the downside, initial support is near to the level of $0.0260 and the 50 moving average on the (4-hours). Also, there is a crucial bullish triangle trend line emerging on the 4-hour chart with support near $0.0260 level. Unless there is a downside fall underneath the support levels of $0.0260 and $0.0223, this might plunge to the low level of $0.0170.
Note: Kryptomoney.com is not a financial advisor. Do your research before investing your funds in any financial asset or presented product or event. We are not responsible for your investing results
Image Credit: Shutterstock
Keep in mind that we may receive commissions when you click our links and make purchases. However, this does not impact our reviews and comparisons. We try our best to keep things fair and balanced, in order to help you make the best choice for you.