
Highlights
The world’s most valuable cryptocurrency is now slowly returning to the bull market territory after its remarkable correction from its all-time highs of $64,899 to $47,044 low level on Sunday. Bitcoin remains under pressure in the cryptocurrency market after bulls emerge to reclaim the 50-day moving average. BTC/USD latest upside push is confronting the region at $57,000 near the MA 50 barrier in a bid to flip into support, although current positive impetus appears somewhat frail amid weakened bullish backing from retail buyers. Bitcoin has maintained its rebound from a monthly low of $47,044 and continues to surge during today’s trading session from an open price of $53,580 to an intraday’s high of $57,078 at the time of this post. With a market cap of $1.024 trillion and $46.34 billion in trading volume over the last 24 hours, the crypto asset stays at no.1 on the Coinmarketcap index. On May 3, the Chicago Mercantile Exchange (CME) will introduce Micro Bitcoin Futures (MBT), which may spark a renewed interest from retail buyers.
Key Levels
Resistance Levels: $65,000, $62,500, $60,000
Suppport Levels: $53,000, $50,000, $47,000
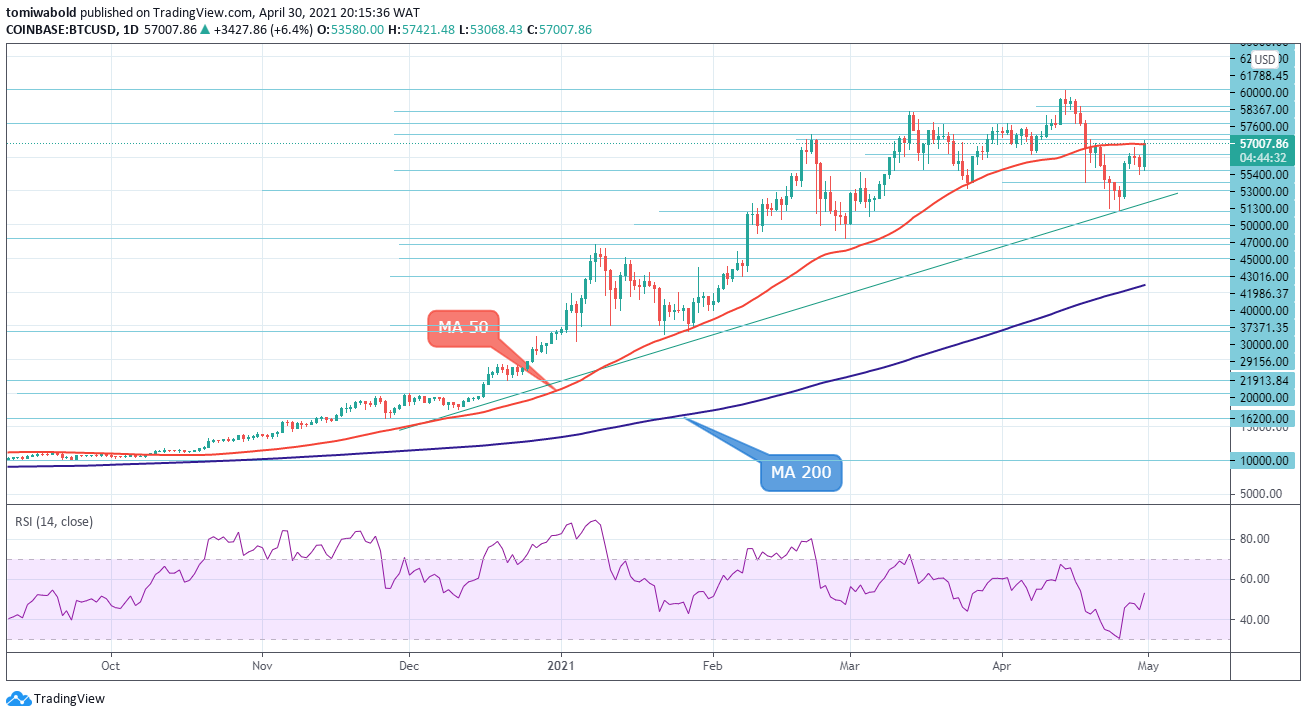 BTC/USD Daily Chart
The BTC/USD maintained upside trading within an ascending pattern after the prior day’s rebound from the $52,369 level. The pair made around 8% move during Friday’s trading session. Currently, BTC is trading near the upper boundary of the moving average (MA 50) and could be set for a breakout towards $60,000. If selling interest persists, support may originate initially from the nearby lower frontier of the channel around the $51,300 mark.
If the breakout occurs, a retracement towards the $51,300 low level could be expected within subsequent sessions before moving towards the $65,000. However, if the moving average barrier holds, bearish traders could target the weekly support level at $47,044. The climbing moving averages (MAs) are defending the bullish structure, while the RSI is struggling to improve further into the bullish territory.
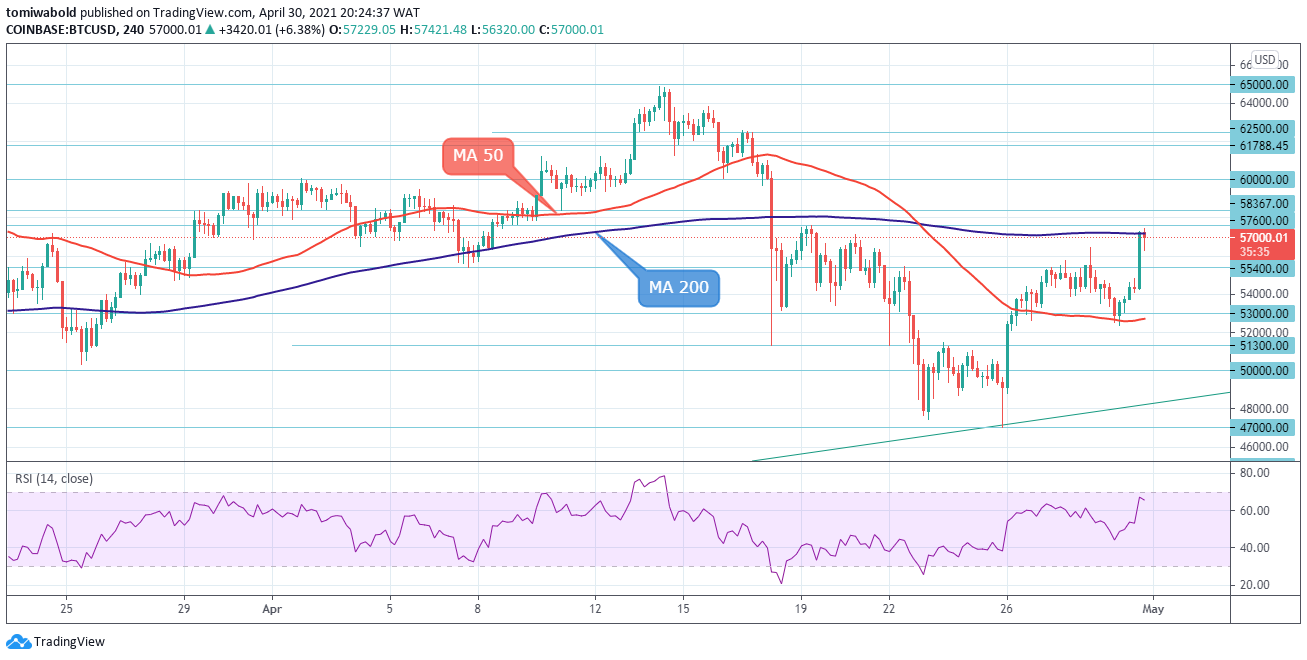 BTC/USD 4-Hour Chart
Bitcoin remains under pressure on Friday, with the moving averages (MAs) highlighting the next major move could come once the $53,000 to $57,000 price range is broken. Sustained losses below the $55,400 level could easily cause further downside towards the key $51,300 near the term support level. Repeated upside failure around current levels could easily be sold back down towards the $51,300 support zone.
The short-term oscillators are reflecting some waning positive momentum after caps emerged at the 4-hour moving average (MA 200), suggesting sellers may seize the upper hand for now. The relative strength index (RSI), stays in the positive region and holding above its 60 reading. The moving average (MA 50) line is turning north to protect BTC’s advance and is promoting growing positive price action towards $60,000.
Note: Kryptomoney.com is not a financial advisor. Do your research before investing your funds in any financial asset or presented product or event. We are not responsible for your investing results
Image Credit: Shutterstock


Keep in mind that we may receive commissions when you click our links and make purchases. However, this does not impact our reviews and comparisons. We try our best to keep things fair and balanced, in order to help you make the best choice for you.


