
The largest global cryptocurrency, Bitcoin in recent times faced one of its most stable phases after volatile months of price action. The market cap for Bitcoin (BTC) stands today at $167.83 billion, with $16.32 billion exchanged in the past 24 hours. The current spot price is down approx. 10 percent from its high of $10,400 in the year, but beyond 150 percent from lows of $3,858 in March 2020. However, BTC/USD price stays in the range at $9,000 as market sell-off grows. Besides Bitcoin, a stock market downturn may cause a crypto-market pullback due to its high correlation with stocks since March. Market participants’ unwillingness to partake in risk-on assets may potentially result in higher near-term panic selling on the BTC. The latest release of Bitcoin’s S2FX price model on July 1 reveals that Bitcoin (BTC) may struggle to hit $10,000, but its growth is well on the path as needed to continue the long-term bullish trajectory.
*The current spot price is down approx. 10 percent from its high of $10,400 in the year, but beyond 150 percent from lows of $3,858 in March 2020
*However, BTC/USD price stays in the range at $9,000 as market sell-off grows
*The latest release of Bitcoin’s S2FX price model on July 1 reveals that Bitcoin (BTC) may struggle to hit $10,000
Key Levels
Resistance Levels: $10,000, $9,800, $9,500
Support levels: $9,000, $8,800, $8,500
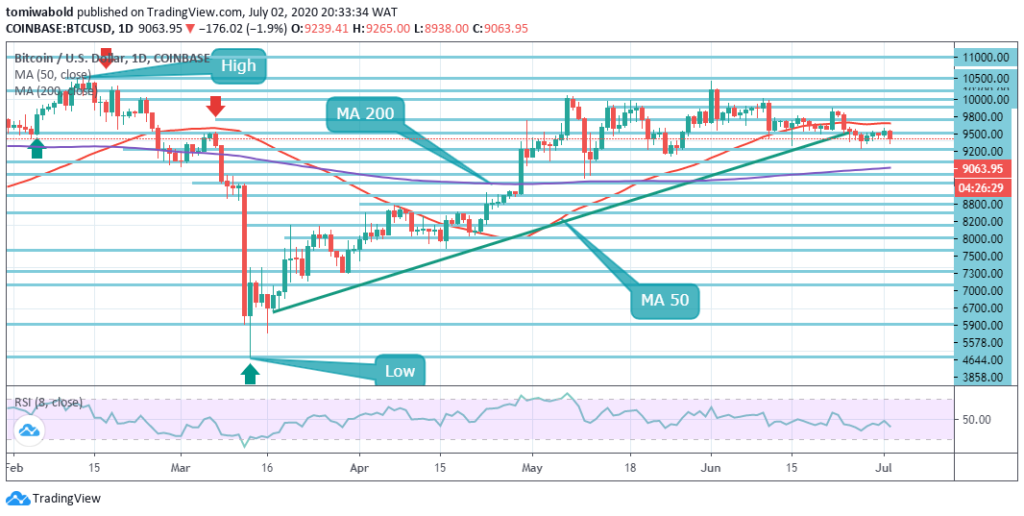 BTC/USD Daily Chart
BTC/USD recorded its daily highs at $9,265 earlier in the day, after many attempts to revert to the prior level around $9,300. Amidst the recovery, in a couple of moments, BTC/USD promptly fell from $9,265 to $8,938. The sharp sell-off has brought Bitcoin under $9,000 recently, though the BTC price presently persists over $9,000. The support is offered by the $9,000 psychological level while the upside is capped by the $9,265 intraday level.
Feasible activity in either position is required to build traction as market volume increases with the BTC/USD price remaining within $9,000, which implies that the coin can be exposed to sharp movements in either path, once the movement is triggered. A drop beneath the current support level, nonetheless, may trigger a volatile sell-off.
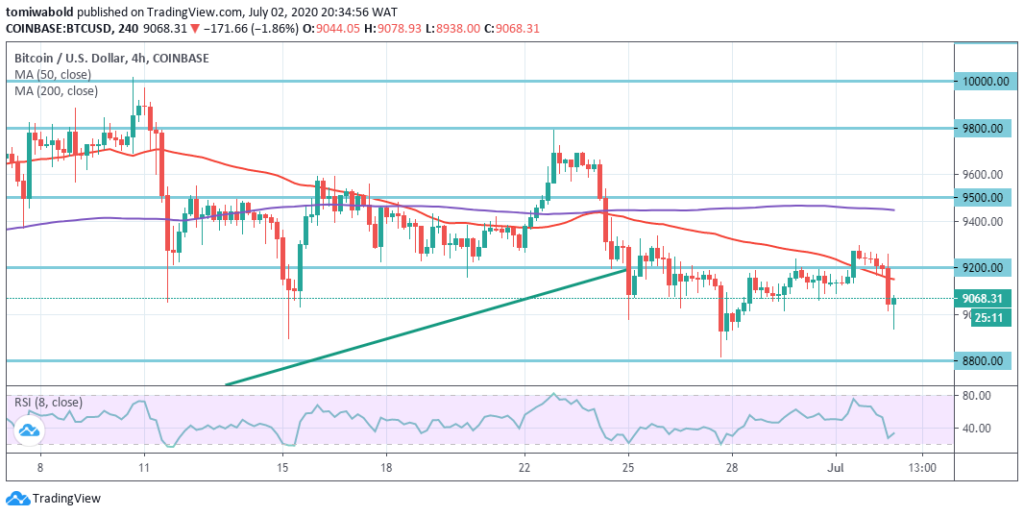 BTC/USD 4-Hour Chart
On the intraday level, the coin has advanced inside the recent tight range amid a short-term bearish bias. Bitcoin is scrambling to retain a directional bias as uncertainty tumbles to the lowest of 2020 around the number one crypto-currency. If bulls consistently struggle to push the price beyond the level of resistance of $9,200 then the impetus to sell may tend to commence.
If the support level of $9,000 is breached with conviction then the BTC/USD pair may begin falling back to the level of $8,800. The BTC/USD pair is only bullish while holding beyond the level of $9,200; key resistance is seen at the levels of $9,500 and $9,800. If the BTC/USD pair exchanges beneath the level of $9,000, sellers may test support levels of $8,800 and $8,500.
Note: Kryptomoney.com is not a financial advisor. Do your research before investing your funds in any financial asset or presented product or event. We are not responsible for your investing results
Image Credit: Shutterstock


Keep in mind that we may receive commissions when you click our links and make purchases. However, this does not impact our reviews and comparisons. We try our best to keep things fair and balanced, in order to help you make the best choice for you.


