
The world’s biggest cryptocurrency by market cap stands against its US Dollar pairing in a bullish stance. As of Tuesday’s American session, the BTC/USD exchange rate was up 2.1 percent to $9,353. The pair was trading at $9,438, while at its intraday peak. Presently the BTC market cap is at $172.22 billion, with $17.98 billion traded over the past 24 hours. In the meantime, all the top coins tailed Bitcoin’s uptrend swings. In the near-term, investors are shifting steadily bullish after a low-volatility run. This potential portends well to see upside rally return as BTC/USD surge past $9,400. Bitcoin reacts on Tuesday while the members of the European Union reached a landmark deal on a $2tn stimulus package. A consensus among the 27 members of the European Union in Brussels went into its fifth day – the most prolonged 20-year session – to negotiate the next economic direction of the region amid COVID-induced recession.
*As of Tuesday’s American session, the BTC/USD exchange rate was up 2.1 percent to $9,353
*This potential portends well to see upside rally return as BTC/USD surge past $9,400
*Bitcoin reacts on Tuesday while the members of the European Union reached a landmark deal on a $2tn stimulus package
Key Levels
Resistance Levels: $10,000, $9,800, $9,500
Support levels: $9,200, $9,000, $8,800
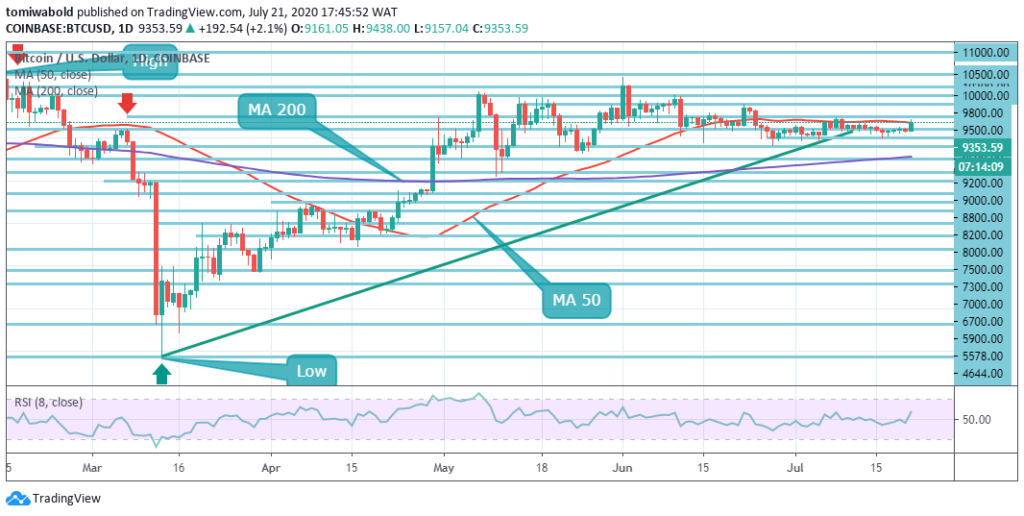 BTC/USD Daily Chart
Looking at the daily chart of BTC/USD, the price breached beyond a main horizontal resistance zone associated with the MA 50 line. A breakout beyond that level may most probably propel Bitcoin past $9,500, as pointed out in the prior analysis. Besides that, the MA 50, capped the initial charge of Bitcoin. The pressure of the sellers in this zone appears to be high, but if the technical context of Bitcoin stays unchanged, it may only be a waiting game before the $9,500 price falls.
The RSI with its upward sloping motion, reveals the firm bullish pressure. The decreasing disparity seen between price and the MA 50 indicates that for a while bulls may stay at the pilot’s seat. In case a turnaround comes into the equation, and Bitcoin starts losing momentum, support is anticipated at levels of $9,200, $9,000, and $8,800.
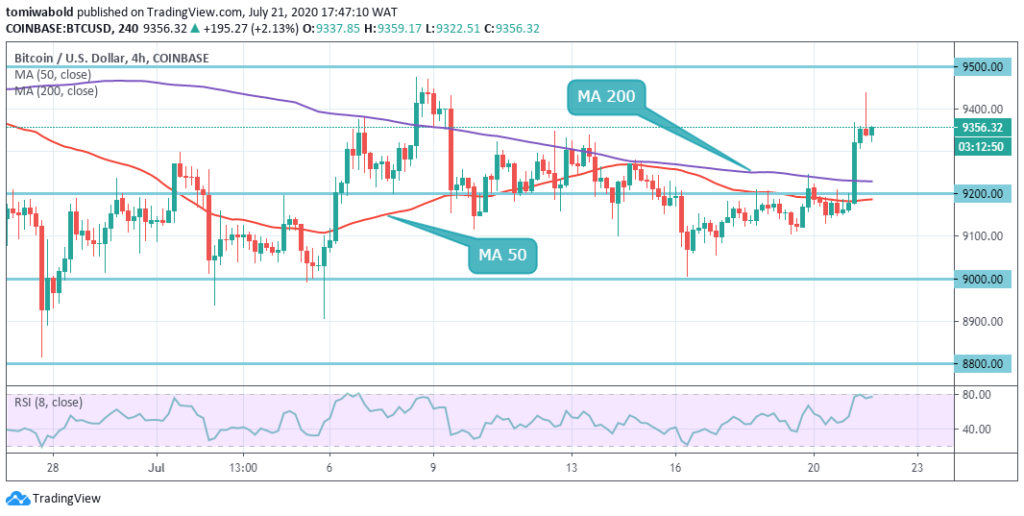 BTC/USD 4-Hour Chart
Bitcoin is aiming to create traction to the upside after bulls already breached on the lower time frame through the main MA 50 and MA 200 sloping pattern. Technical analysis suggests that if the $9,438 intra-day high level is surpassed, the BTC/USD pair may rally toward the $9,500 mark. The RSI on the 4-hour chart, nevertheless, has flipped to the upside, suggesting at this point the bullish situation is more probable.
A price close back beneath the support level of $9,200 may validate a misleading upside breakout for the BTC/USD pair. The BTC/USD pair is only bullish while exchanging beyond the level of $9,200; the main resistance is discovered at the levels of $9,500 and $9,800. Sellers may test the $9,000 and $8,800 levels once the BTC/USD pair exchanges beneath the $9,200 level.
Note: Kryptomoney.com is not a financial advisor. Do your research before investing your funds in any financial asset or presented product or event. We are not responsible for your investing results
Image Credit: Shutterstock


Keep in mind that we may receive commissions when you click our links and make purchases. However, this does not impact our reviews and comparisons. We try our best to keep things fair and balanced, in order to help you make the best choice for you.
