Since the start of the new year, the world’s second-largest cryptocurrency by market cap has pushed to the upside. Today, the crypto market scene has a neutral bias for the ETH/USD pair which has stabilized within a small range. ETH has stayed marginally unchanged over the past 24 hours as it is trading with a market cap of $25.24 billion and a trading volume of $6.42 billion. The overall bias of the pair stays optimistic following market correction as ETH/USD trades past $220. In the market, the current spot price of ETH/USD is down daily from an intra-day high of $228.69 with a 1.30 percent loss to $225. The first public Ethereum 2.0 Testnet “Altona” is now live, almost the final before the actual launch of the 2.0 update as another Testnet will be unveiled sometime after Altona in July. Investors are accumulating more Ethereum coins while assuming that ETH 2.0 may certainly have a major effect on the value retained by Ethereum.
*The overall bias of the pair stays optimistic following market correction as ETH/USD trades past $220
*In the market, the current spot price of ETH/USD is down daily from an intra-day high of $228.69 with a 1.30 percent loss to $225
*The first public Ethereum 2.0 Testnet “Altona” is now live, almost the final before the actual launch of the 2.0 update as another Testnet will be unveiled sometime after Altona in July
Key Levels
Resistance Levels: $255, $250, $245
Support levels: $220, $210, $200
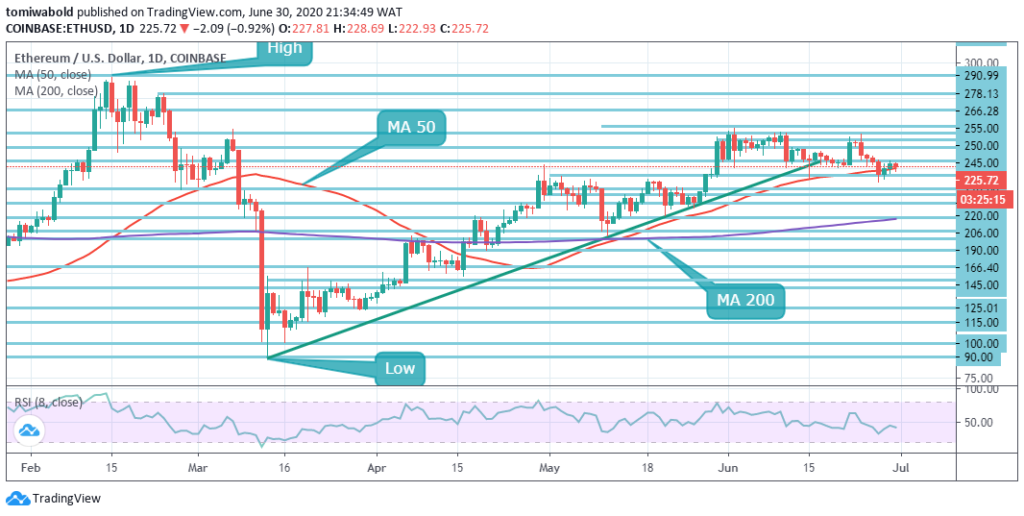
 ETH/USD Daily Chart
The ETH/USD has been shifting in sync with the overall market. ETH/USD is entangled by the daily MA 50 (presently at $225.00). The shift has enhanced the analytical context but for the upside to gain traction, a viable shift beyond $230.00 is required. Once it’s out of the path, recovery may progress to $245.00 (the next horizontal line of resistance) and $250.00 key barrier.
The upper boundary of the sellers’ confluence zone at $250 reinforces this barrier. From a long-term perspective, the price level of $250.00 is a crucial obstacle that acted as the upper boundary of the prior consolidation channel that limited the recovery in early June. On the contrary, nearby support is formed by the aforementioned daily MA 50 led by the psychological $220.00, and the prior week’s lowest level at $215.16.
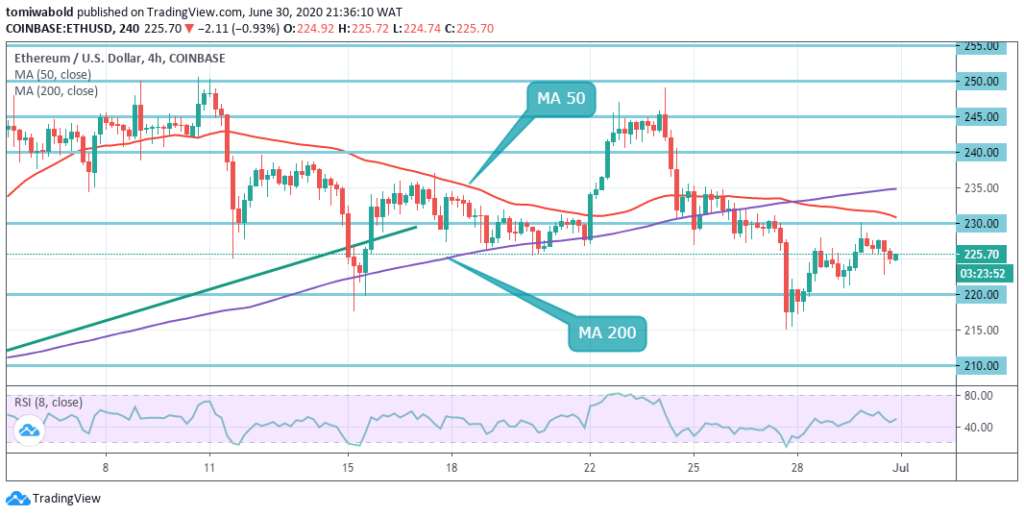
 ETH/USD 4-Hour Chart
As identified on the 4-hour time frame, Ethereum is beginning to come under pressure beneath the level of $230.00 as Bitcoin and the wider cryptocurrency market trades sideways. A breakout under the support level of $220.00 may see the ETH/USD pair facing major losses in the upcoming sessions. In the short term the pair exchanges beneath both MA 50 and MA 200.
Trading volatility may begin to rise in the next session as investors accumulate more Ethereum coins while the belief that ETH 2.0 may certainly have a major effect on the value of Ethereum. The ETH/USD pair is only bullish while trading beyond the level of $220.00; its main resistance is seen at levels of $250.00. Once the ETH/USD pair exchanges beneath $220.00, sellers may test the support levels of $200.00 and $190.00.
Note: Kryptomoney.com is not a financial advisor. Do your research before investing your funds in any financial asset or presented product or event. We are not responsible for your investing results
Image Credit: Shutterstock
Keep in mind that we may receive commissions when you click our links and make purchases. However, this does not impact our reviews and comparisons. We try our best to keep things fair and balanced, in order to help you make the best choice for you.