
After the March 12 market carnage, Ethereum (ETH) moved in an upward pattern alongside Bitcoin despite the cryptocurrency market nosedive of about 100 percent. The King Altcoin (ETH) has traded in an upside range limited by $250.00 since the rebound, until recently reaching a $253.60 high. ETH/USD increases in value at $240 at the time of publishing. After the beginning of the day, the coin has gained 2 percent and held steady daily. The value of funds locked up on Decentralized Finance Applications (DeFi) smart contracts reached nearly $1 billion, despite a sharp decline in March in the cryptocurrency market as the number of funds on smart-contracts bottomed at $538 million. Moreover, as per DeFi Pulse stats, the indicator executed a V-shaped reversal and rebounded to 975 million, amid the rapid rise in Ethereum coins locked in the DeFi application.
*The King Altcoin (ETH) has traded in an upside range limited by $250.00 until recently registering a high of $253.60
*ETH/USD increases in value at $240 at the time of publishing
*The indicator executed a V-shaped reversal and rebounded to 975 million, amid the rapid rise in Ethereum coins locked in the DeFi application.
Key Levels
Resistance Levels: $266, $255, $250
Support levels: $230, $220, $206
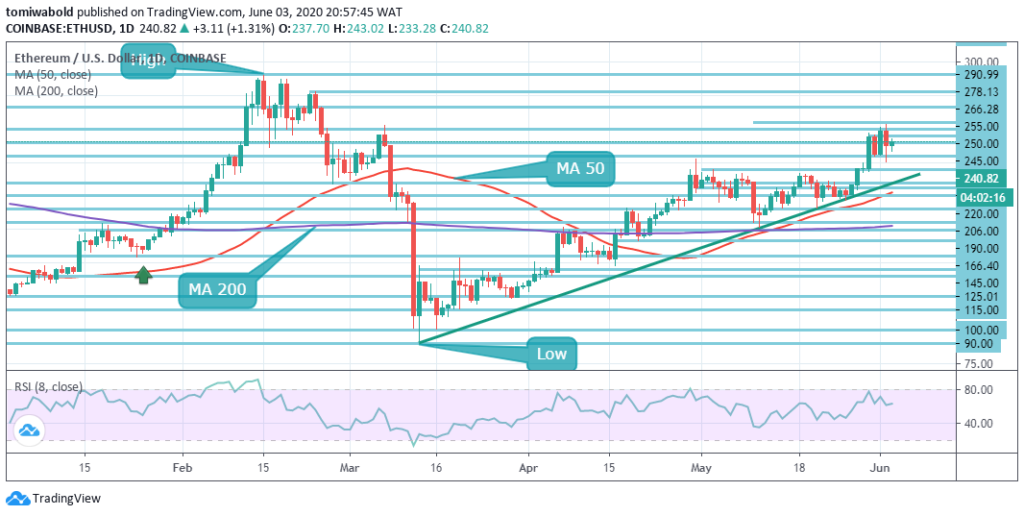 ETH/USD Daily Chart
Ethereum (ETH) has recovered upward the resistance established at $240.00 from the upper bound of the prior consolidation level. The King Altcoin has rebounded at $225 from the low on Tuesday, heading over the horizontal barrier line which is a strong indicator. The intraday RSI goes north and the bullish pattern reinforces. Until $240.00 has breached optimally, turnaround may very well be stretched to $250.00.
ETH/USD squeeze buyers may consider starting new long positions from either the level of $240.00 or the level of $230.00 over the medium to long term. It’s essential to mention that if the $250.00 resistance level is surpassed, the ETH/USD pair might reach the $255.00 level. Only when ETH/USD pair exchanges underneath $230.00, sellers may test the support levels of $220.00 and $206.00.
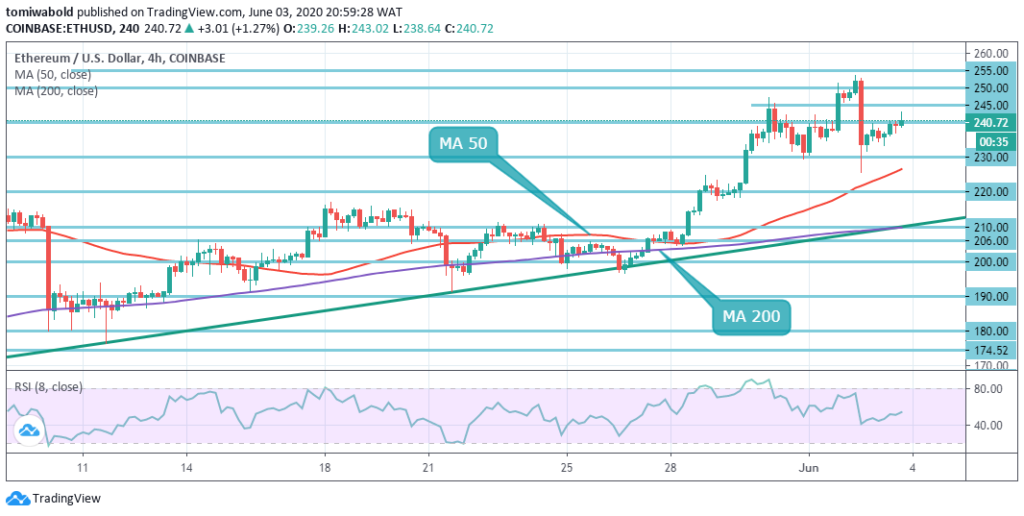 ETH/USD 4-Hour Chart
On the intraday chart, ETH/USD trades at $240.00 beyond the MA 50 but the further rise may be constrained by the short-term consolidation channel’s upper bound at $245.00. Since breaching the $230 handle, this short-term confluence zone has been tested a few times, which means ETH bulls may strive at this barrier. If it’s out of the path, with the next emphasis on $250 the upside is likely to get traction.
This is the recent high rebound which is dividing the price from the next $255.00 psychological level. From a technical point of view, Ethereum is still in the bulls’ possession amid the daily strong correction. The RSI displays a slightly bullish variance that positions potential buyers in the right lane. Other than, within the positive area the indicator also shifts north. Once the support of MA 50 is breached, the sell-off could be lowered to $206.00 psychological level.
Note: Kryptomoney.com is not a financial advisor. Do your research before investing your funds in any financial asset or presented product or event. We are not responsible for your investing results
Image Credit: Shutterstock


Keep in mind that we may receive commissions when you click our links and make purchases. However, this does not impact our reviews and comparisons. We try our best to keep things fair and balanced, in order to help you make the best choice for you.
