
The Altcoin market succumbed to another unexpected selloff on US election day. However, Chainlink traders appear to get used to breaching support after another. Like many other Altcoins, Chainlink (LINK) faced a strong correction from its all-time high of $20, set in the middle of August. After a rebound in late October to highs of $13, LINK suffered a price rejection consequently. If the price falls beneath near-term support of $10, the decline may further as LINK/USD plummets. Chainlink bulls keep working around the clock to ensure that the support at $10 is defended at all costs. As of this article’s writing, Chainlink trades for $10.38, down nearly 5% in the last 24 hours. The LINK market cap presently stands at $4.01 billion, based on a 390 million circulating token supply, with $1.65 billion in trade volume over the past 24 hours. Chainlink development activity spikes after achieving 29 integrations in October. Santiment, a blockchain analytics firm, recently reported that the amount of activity taking place on Chainlink’s public Github repository has been on a clear uptrend despite inconsistent price action.
*If price fails beneath near-term support of $10, the decline may further as LINK/USD plummets
*Chainlink trades for $10.38, down nearly 5% in the last 24 hours
*Chainlink development activity spikes after achieving 29 integrations in October
Key levels
Resistance Levels: $15.00, $13.50, $11.00
Support Levels: $10.00, $9.20, $8.35
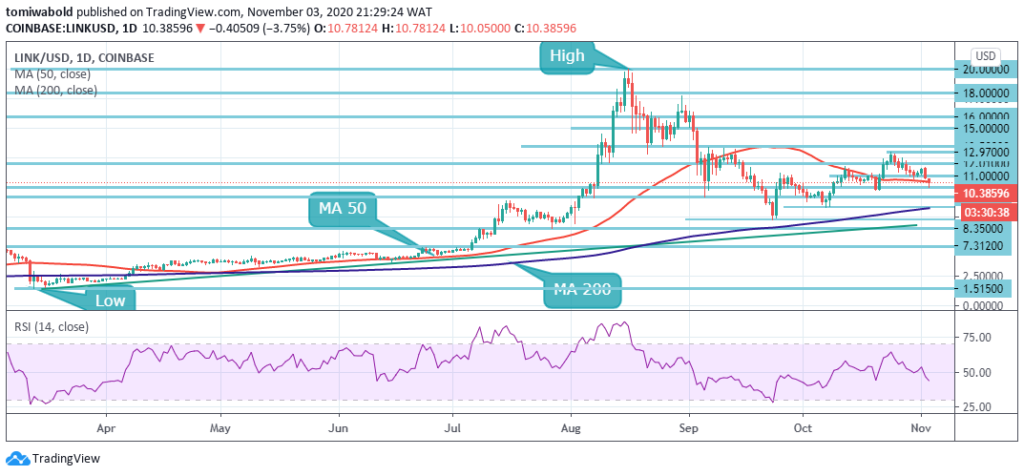 LINK/USD Daily Chart
A bearish narrative is seen on the daily chart, in the wake of the rejection at $13. A climb past the MA 50 which had acted as a resistance cap in late October caused LINK to test $13, but a downtrend ensued afterward. The downtrend stretched under the MA 50, where it retested the critical support at $10. The decline may further as the path of least resistance remains downwards. Closing under the $10 key level will probably extend the losses to the primary support range between $9 and $7.
On the flip side, a reversal is likely to come into play if LINK bulls can hold the $10 range which will spur a move towards $13 and consequently $15. The bullish scenario may also be reinforced if the RSI sustains its motion towards the midline.
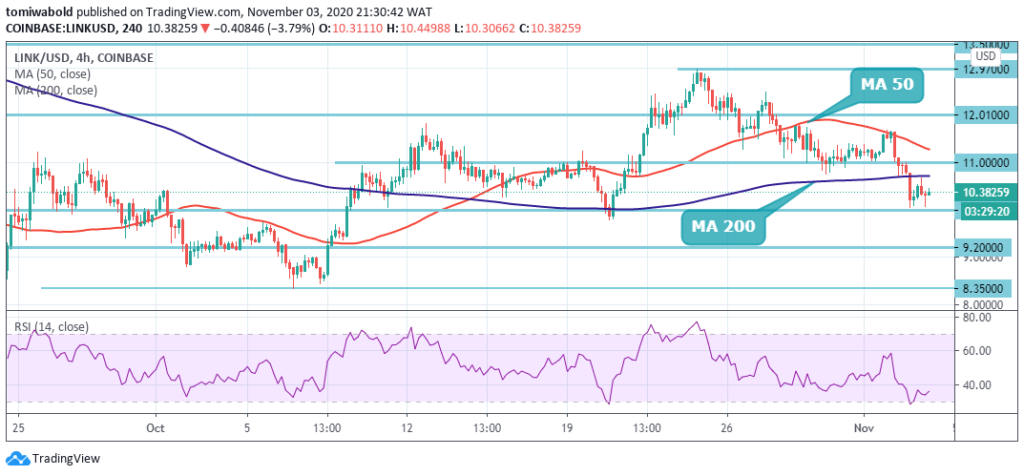 LINK/USD 4-Hour Chart
On the 4-hour chart, the LINK downtrend stretched under the MA 200 coinciding with the $10.71 mark under which it is presently confined. Chainlink bulls are struggling to protect the $10 support as LINK/USD could plunge between $9 and $7. The outlook remains bearish with the 4-hour RSI touching down beneath 40.
On the upside, the 4 hour MA 200 limits price action ahead of other resistance levels at the MA 50 and that seen at $13. The LINK/USD pair is only bullish while trading above the $11 level, key resistance is found at the $12.97 and the $15 levels. If the LINK/USD pair trades below the $11, sellers may test the $10 and $9.20 support levels.
Note: Kryptomoney.com is not a financial advisor. Do your research before investing your funds in any financial asset or presented product or event. We are not responsible for your investing results
Image Credit: Shutterstock


Keep in mind that we may receive commissions when you click our links and make purchases. However, this does not impact our reviews and comparisons. We try our best to keep things fair and balanced, in order to help you make the best choice for you.


