
The entire crypto market had a mini bull rally in the prior week during which Bitcoin climbed past $13k. Bitcoin (BTC) has now settled above $13,000 however further growth seems to be limited. Chainlink (LINK) also exploded in the wake of PayPal announcing the support of cryptocurrencies to buy and sell. LINK cracked several key resistance levels consequently till it met stiff resistance. A near term correction ensues on LINK/USD as bears emerge beneath $12. Following a rejection, LINK plunged from its October 24 high of $12.97 to mid $11 where it trades presently. At the time of writing, LINK/USD is changing hands at $11.66 down by 6.98% since the day’s start. The LINK market cap presently stands at $4.48 billion, based on a 389 million circulating token supply, with $1.31 billion in trade volume over the past 24 hours. Chainlink deploys Verifiable Random Function (VRF) for Ethereum developers to make random outcomes in games more decentralized. Chainlink VRF is being applied to the newest release of the popular DeFi lottery called PoolTogether.
*A near term correction ensues on LINK/USD as bears emerge beneath $12
*Following a rejection, LINK plunged from its October 24 high of $12.97 to mid $11 where it trades presently
*Chainlink deploys Verifiable Random Function (VRF) for Ethereum developers to make random outcomes in games more decentralized.
Key levels
Resistance Levels: $15.00, $13.50, $12.00
Support Levels: $11.00, $10.00, $9.20
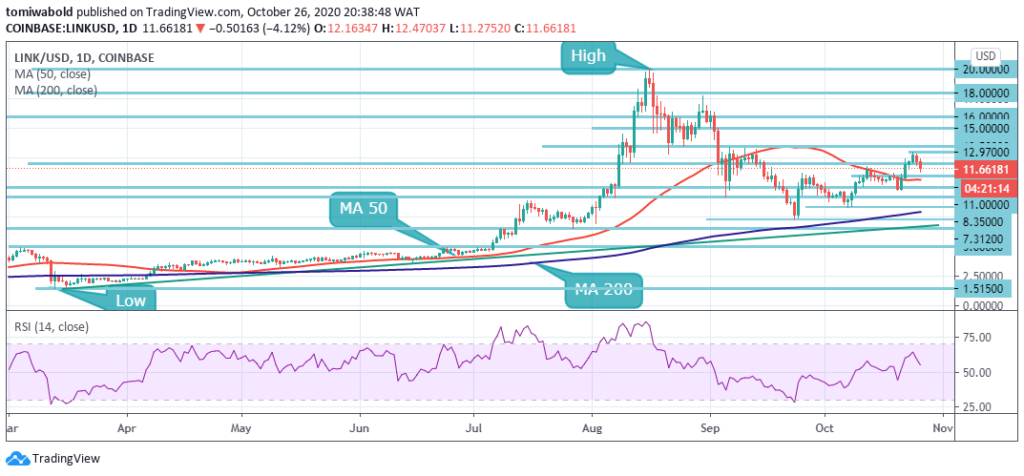 LINK/USD Daily Chart
As seen on the daily chart, LINK has lost steam after hitting a barrier on its way to $13. Selling pressure keeps mounting which can drive Chainlink down to the next support area between $10.05 and $10.91. On the 24 hour timeframe, bears have emerged which may signal a downtrend. The RSI reinforces the bearish outlook as it slides to the midline.
On the other hand, if a bullish reversal occurs, LINK could climb past $12 to mark a breach above $13 which would ultimately push LINK up to $15. After hitting a yearly high of $20 on 16th August, LINK price has since charted a series of lower highs and lower lows. To lead it back towards its $20 all-time highs, bulls must shatter the resistance sitting at $13.00.
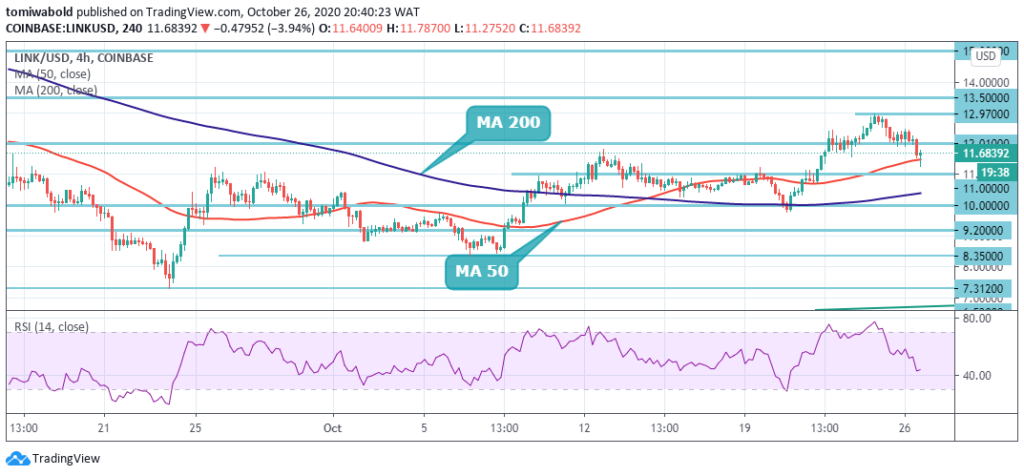 LINK/USD 4-Hour Chart
On the 4-hour chart, a sell signal is presented. The significant resistance it faced at $12.97 sparked a sharp selloff beneath its 4-hour MA 50. A further plunge from this level can send LINK as low as $10 where the MA 200 is currently established. The outlook remains bearish with the 4-hour RSI touching down close to 40.
Failure to reclaim the $12 level could provoke another downside attack beneath the 4 hour MA 200 support barrier. The LINK/USD pair is only bullish while trading above the $12.01 level, key resistance is found at the $13.50 and the $15 levels. If the LINK/USD pair trades below the $11, sellers may test the $10 and $9.20 support levels.
Note: Kryptomoney.com is not a financial advisor. Do your research before investing your funds in any financial asset or presented product or event. We are not responsible for your investing results
Image Credit: Shutterstock


Keep in mind that we may receive commissions when you click our links and make purchases. However, this does not impact our reviews and comparisons. We try our best to keep things fair and balanced, in order to help you make the best choice for you.
