
The turbulent weekend weighs heavily on major Altcoins in the DeFi industry, including LINK. Chainlink has been on a downward trajectory since it emerged against a $20 (new 2020 high) barrier. The first week of September was not only gruesome for Chainlink but other major cryptocurrencies such as Bitcoin and Ethereum as well. LINK/USD has attempted a recovery above the daily MA 50 while recording an intraday high of $13.16. The token stays vulnerable with likely bearish bias beneath $12 on LINK/USD. The LINK market cap stands today at $4.25 billion, based on a circulating token supply of 350 million, with a trading volume of $2.25 billion over the last 24 hours. LINK/USD is changing hands at $12.09 at the time of writing, down nearly 7 percent since the day’s start. The on-chain metrics supplied by Intotheblock flashes red while suggesting that LINK price recovery may have a hard time pushing past $12.50. As investors may look to cash out on breakeven prices due to increased selling activity at entry points.
*LINK/USD has attempted a recovery above the daily MA 50 while recording an intraday high of $13.16
*The token stays vulnerable with likely bearish bias beneath $12 on LINK/USD
*The on-chain metrics supplied by Intotheblock flashes red while suggesting that LINK price recovery may have a hard time pushing past $12.50
Key Levels
Resistance Levels: $18.00, $15.00, $13.00
Support Levels: $12.00, $10.00, $7.00
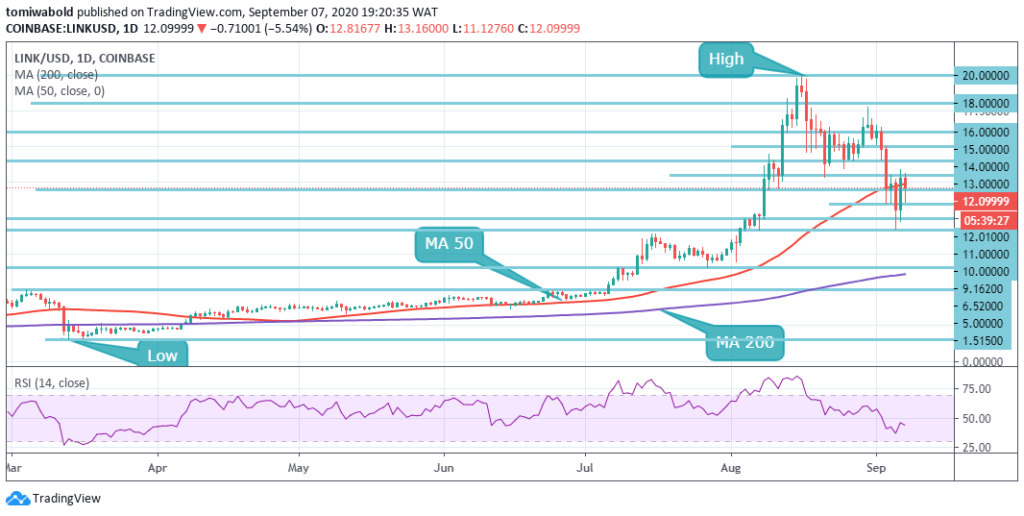 LINK/USD Daily Chart
Following its latest climb to a new all-time high of $20, Chainlink has experienced a pullback with it currently trading back down at $12.09. The spot price relative to the MA 50 is used on the LINK/USD market daily chart as a guidepost for the trend. On September 3rd, LINK/USD infringed the MA 50 main support level around $12.50 which is now acting as a barrier.
Although the price dropped to a low level of $9.22, it managed to reclaim some ground, but the potential for rebound receded when it reached $13.00. LINK struggled to stabilize beyond the daily MA 50 (presently close to $12.50), adding to bearish market sentiments. The pattern may persist until the spot prices stay underneath the MA 50.
 LINK/USD 4-Hour Chart
Chainlink stays vulnerable to more losses as the LINK token tends to exchange beneath the technical key $13 mark. Bearish RSI price on the lower time frame is presently flashing of a steeper fall under the $12 mark. To resist more selling beneath the psychological $12.50 mark, bulls require to hold the LINK/USD pair beyond the $13 mark.
A steady step beneath this region may signify that the bullish trend is over, and the price is willing to head back to the range that prevailed in the first half of 2020. The LINK/USD pair is only bullish while exchanging beyond the $14 mark, the main resistance is at the $15 and $18 levels as identified. If the LINK/USD pair exchanges under $12, sellers may test the $11 and $10 support levels.
Note: Kryptomoney.com is not a financial advisor. Do your research before investing your funds in any financial asset or presented product or event. We are not responsible for your investing results
Image Credit: Shutterstock


Keep in mind that we may receive commissions when you click our links and make purchases. However, this does not impact our reviews and comparisons. We try our best to keep things fair and balanced, in order to help you make the best choice for you.

