The cryptocurrency market is mostly painted red after BTC plunged to lows of around $30k. Chainlink, alongside major Altcoins, is leading the steep Altcoin correction. Chainlink topped at $18.50 on January 10th and started the downside correction to reach intraday lows of $12.50 on December 11th. Declines on LINK/USD pauses beneath $13 after a massive dive from an opening price of $16.21. At the time of writing, LINK retreated to $13.58, having lost 19.40% daily. Despite the declines, Chainlink is up marginally by 0.85% weekly. The LINK market cap presently stands at $5.51 billion, based on a 390 million circulating token supply, with $3.21 billion in trade volume over the past 24 hours. Warp Finance integrates Chainlink Oracles to serve as protection against similar exploits. Warp Finance, a DeFi lending protocol that suffered an $8 million flash loan exploit shortly after release is now preparing for a relaunch that will include integration with Oracles by Chainlink.
*Chainlink topped at $18.50 on January 10th and started the downside correction
*At the time of writing, LINK retreated to $13.58, having lost 19.40% daily
*Warp Finance integrates Chainlink Oracles to serve as protection against similar exploits
Key levels
Resistance Levels: $18.00, $16.00, $15.00
Support Levels: $11.00, $10.00, $9.20
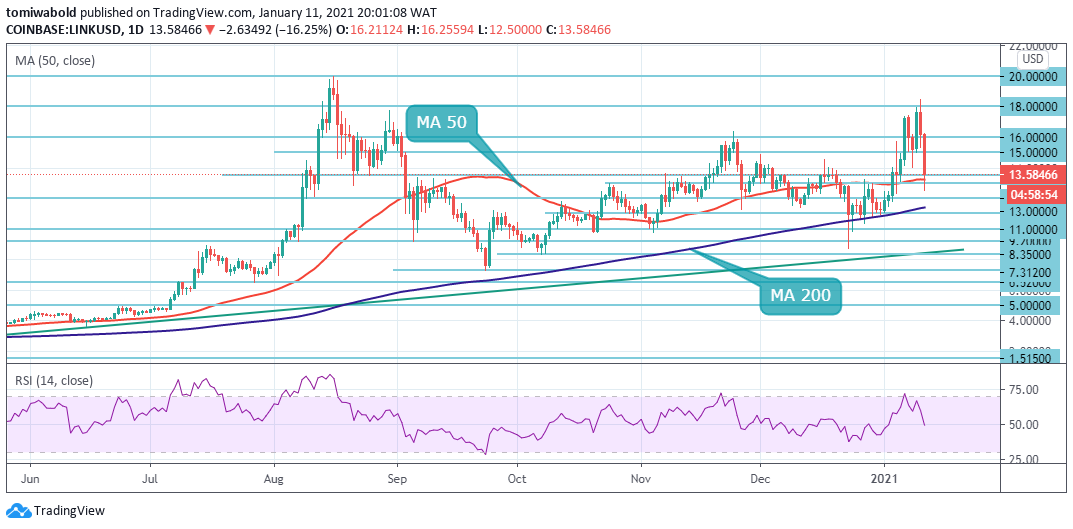 LINK/USD Daily Chart
LINK/USD opened the week’s trading in substantial losses. Chainlink (LINK) turned down from the $18.50 resistance on Jan. 10, and that attracted further selling by short-term traders who dragged the price down to lows of $12.50 today. The bulls however rose to defend the $13.50 support located around the MA 50 close as seen in a slight rebound.
On the upside, If the bulls can propel the price beyond $15 and past the resistance at $18.50, the LINK/USD pair could rally to $20. Once these hurdles are crossed, LINK could extend its upside gains beyond $25. However, if the price turns down from its current level once again, then the pair may consolidate at the $13 support for a few days. A sustained break below the MA 50 and 200 at $13.24 and $11.41 will signal that the bears are back in the game.
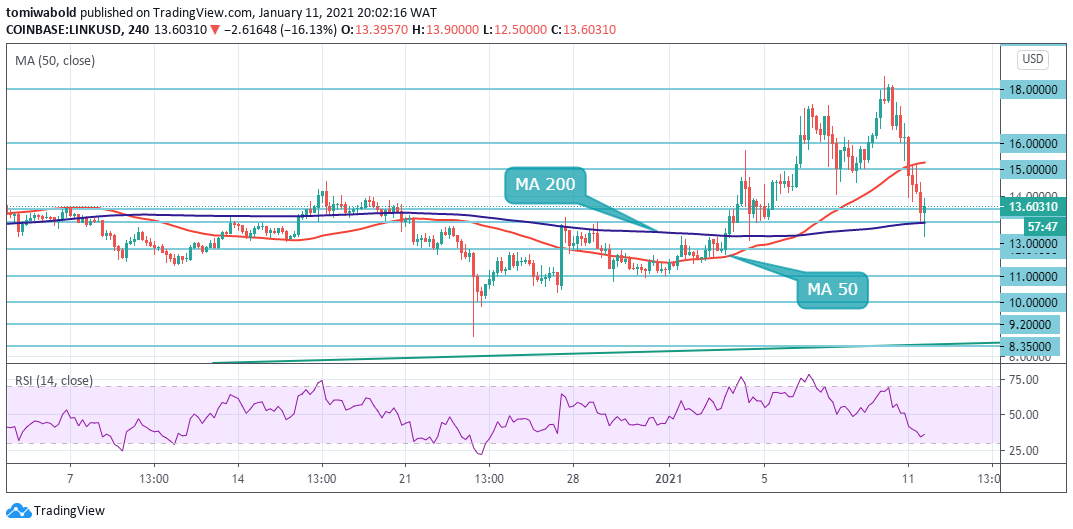 LINK/USD 4-Hour Chart
As observed on the 4-hour chart, LINK/USD lost the MA 50 at $15.15, while depending on MA 200 at $13.00 to hold. Trading past the $13 support remains the bulls’ short-term priority. This will allow them to shift the focus back to the $14 mark and $15.23 around 4 hour MA 50 respectively.
On the other hand, the bearish scenario appears to have been reinforced by the RSI nearing the oversold territory. A further breakdown from current levels may bring the $11.00 and $10.00 support levels into the picture. The LINK/USD pair is only bullish while trading above the $13 mark, key resistance is found at the $15 and the $16 levels.
Note: Kryptomoney.com is not a financial advisor. Do your research before investing your funds in any financial asset or presented product or event. We are not responsible for your investing results
Image Credit: Shutterstock


Keep in mind that we may receive commissions when you click our links and make purchases. However, this does not impact our reviews and comparisons. We try our best to keep things fair and balanced, in order to help you make the best choice for you.


