
The bull run in the cryptocurrency market seems to have taken a hiatus after Bitcoin paused at a pace of $24,000. In a general market uptrend, LINK rallied to highs of $14.56 on December 17. LINK uptrend was stalled owing to rejection as it plunged to intraday lows of $13.49. The oracle token attempted a bounce back from the $13.19 support but recovery on LINK/USD slowed down again at the $14 barrier. This marks one of the numerous attempts by Chainlink to bounce back up after it suffered a significant blow after reaching its ATH of $20.11. Chainlink presently trades at $13.46, down by 3.29% in the last 24 hours. LINK remains up by more than 15% on a weekly. The LINK market cap presently stands at $5.35 billion, based on a 390 million circulating token supply, with $1.32 billion in trade volume over the past 24 hours. On-chain analytics firm, Santiment noted that Chainlink’s network growth is rising. Presently, new addresses on the network have surged to almost 3,600, representing a 37.5% increase from December 15 lows of 2,250.
*LINK rallied to highs of $14.56 on December 17
*Chainlink presently trades at $13.46, down by 3.29% in the last 24 hours
*On-chain analytics firm, Santiment noted that Chainlink’s network growth is rising
Key levels
Resistance Levels: $16.00, $15.00, $14.00
Support Levels: $12.97, $11.00, $8.35
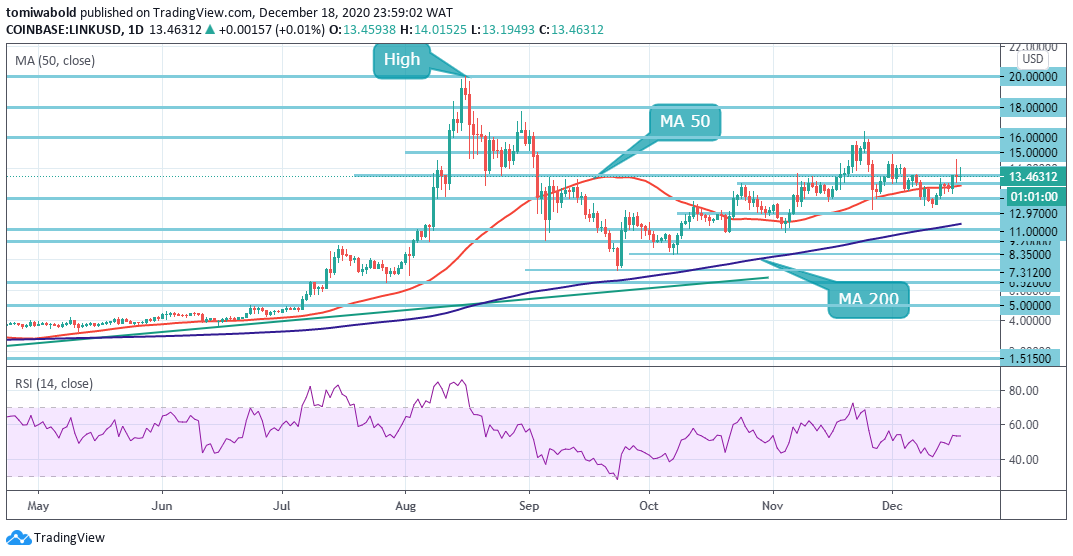 LINK/USD Daily Chart
On December 18, LINK slowed down the recovery at $14, a correction came into the picture to lows of $13.19. In case of extended downside pressure, LINK/USD may need to confirm support at $12.97 at the MA 50 close to prevent further losses. If this support caves in, LINK may be forced to seek the next support at $11.42 from which a rebound occurred on December 11.
Immense selling pressure may cause LINK to retest the MA 200 close at $10.34. The RSI just above the midpoint does not signal a clear advantage either to the bulls or the bears. If the trend turns in favor of the bulls, a sustained move past $14 may cause the LINK/USD pair to rise to $15 and then to $17. If this level is also crossed a retest of the all-time high at $20 is possible.
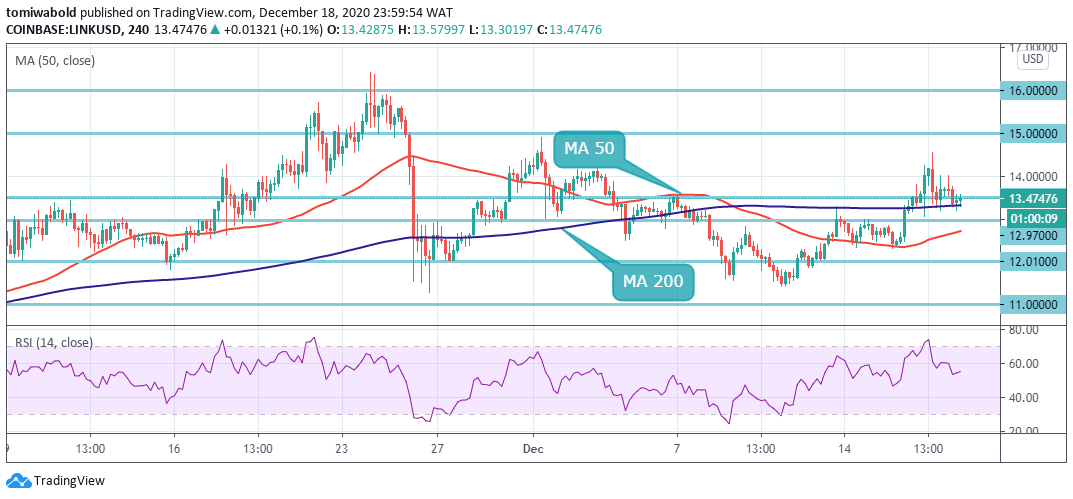 LINK/USD Daily Chart
LINK declines reached lows of $13.20 on the shorter time frame after which a rebound occurred at the MA 200. The next hurdle for the bulls remains the resistance level at $14. Climbing above this point would quickly push Chainlink’s price towards $14.63 where previous rejection occurred. Besides that, the next potential price target would be the top of the pattern at $18 in the long-term.
On the flip side, a breakdown beneath the MA 200 close at $13.31 may cause LINK to retest lower support at the MA 50 close at $12.71. A further breach beneath the MA 50 would have a devastating effect over LINK, potentially pushing it to $8.35. The LINK/USD pair is only bullish while trading above the $13 mark, key resistance is found at the $15 and the $16 levels.
Note: Kryptomoney.com is not a financial advisor. Do your research before investing your funds in any financial asset or presented product or event. We are not responsible for your investing results
Image Credit: Shutterstock


Keep in mind that we may receive commissions when you click our links and make purchases. However, this does not impact our reviews and comparisons. We try our best to keep things fair and balanced, in order to help you make the best choice for you.
