
Altcoins such as Litecoin often rally as Bitcoin consolidates, nevertheless BTC price pulls the whole market down with it after losses beneath $12,000 as traders lock in profits and reinvest a fraction of it into more risky bets. After being rejected from a major barrier at $68.50 of the prior day, LTC/USD is poised for yet another downside shift. It followed the lead of Bitcoin on Wednesday as it plummeted over 9 percent briefly to test beneath $60. LTC/USD downside pressure extends beneath $60 after the loss of upside traction. The market cap stands currently at $3.95 billion, positioning it 7th on the Coinmarketcap index, with an exchange-traded volume of $3.17 billion over the past 24 hours. Litecoin is holding steady at $60.00 after a minor retreat from intraday lows near $59.29. Litecoin developer Charlie Lee recently wrote on twitter to reveal that Litecoin’s SegWit hit an 80% rate ahead of Bitcoin’s 50% rate. Litecoin’s SegWit usage has evolved over the past three years. This has led to a substantial reduction in the network’s transaction fees.
*After being rejected from a major barrier at $68.50 of the prior day, LTC/USD is poised for yet another downside shift
*LTC/USD downside pressure extends beneath $60 after the loss of upside traction
*Litecoin developer Charlie Lee recently wrote on twitter to reveal that Litecoin’s SegWit hit 80% rate ahead of Bitcoin’s 50% rate
Key Levels
Resistance Levels: $72.15, $69.00, $64.00
Support Levels: $55.50, $50.00, $45.00
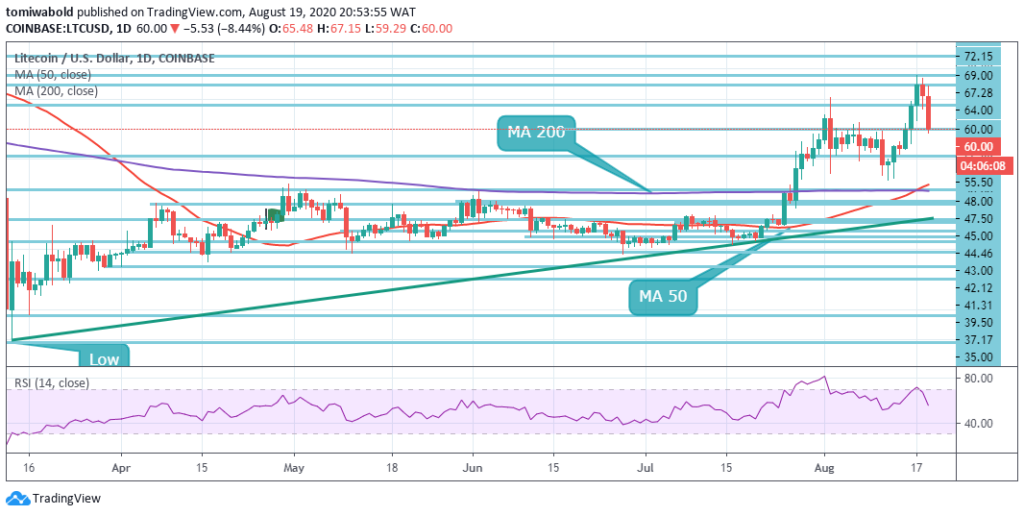 LTC/USD Daily Chart
At the $69.00 horizontal line, LTC/USD met fierce resistance and then went down for two consecutive days. Since then, the price has fallen from the high of $68.50 a day before to $59.29 intra-day low during Wednesday’s American hours. The relative strength index (RSI) has drifted beneath the overbought zone, although the MA 50 has shifted upwards across the MA 200 to support the initial green session.
The price chart indicates $69.00 as one strong resistance. In comparison, we have two levels of healthy support at $60.00 and $55.50. The markets could indicate that the price may test the $55.50 downside border of the pair and then restart shifting upward to attain $72.15. The bullish scenario may no longer be valid once the price breaks the downside border of the pair and fixes underneath $50.00.
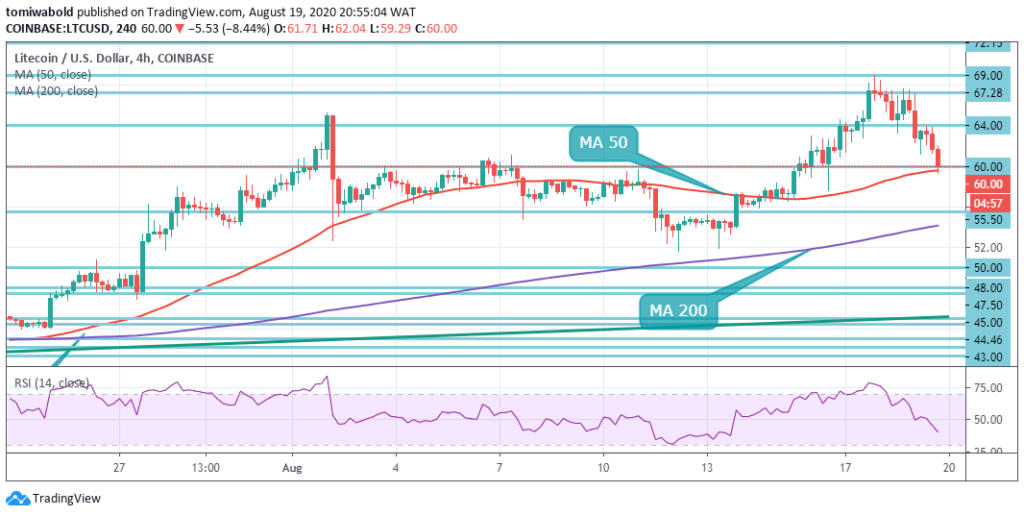 LTC/USD 4-Hour Chart
Litecoin reveals its latest 4-hour trend as being strongly bearish in the short run as traders tend to sell any rallies beyond the near-term resistance level of $64.00. Litecoin is also declining to rally alongside major cryptos and on the lower time frame is beginning to form a bearish head and shoulders pattern. To gain fresh technical buying interest above the $64.00 level, the LTC/USD pair may require to plunge back beneath the $55.00 level.
As noted above, the dominant trend is bearish and this is cited by the slump of the RSI towards the region that’s been oversold. The LTC/USD pair is only bullish while exchanging beyond the level of $55.50; the main resistance is realized at the level of $64.00 and $69.00. Once LTC/USD pair exchanges beneath $55.50, then sellers might test the support levels of $50.00 and $48.00.
Note: Kryptomoney.com is not a financial advisor. Do your research before investing your funds in any financial asset or presented product or event. We are not responsible for your investing results
Image Credit: Shutterstock


Keep in mind that we may receive commissions when you click our links and make purchases. However, this does not impact our reviews and comparisons. We try our best to keep things fair and balanced, in order to help you make the best choice for you.


