
Altcoins have rocketed to new levels in the last few days, with most of them rallying to new yearly highs. XLM, the native token of Stellar Lumens has soared impressively beating its daily gains to surpass $0.19 delivering 101.23% weekly returns. After trading at highs of $0.1166 in middle August, Stellar (XLM) dropped in price and entered a consolidation bout subsequently. In an explosive move amid a broad-based Altcoin market recovery, Stellar bulls breached above $0.18 for the first time since November 2018 hitting a new multi-year high at $0.1990. At the time of writing, XLM/USD is changing hands at $0.1924, having gained 50.94% in the past 24 hours and 101.23% on a week-to-week basis. Stellar is the 12th largest digital asset with a current market capitalization of $3.61 billion and an average daily trading volume of $2.74 billion. On November 23, Stellar developers upgraded the network to Protocol 15. Justin Rice, SDF head of the Ecosystem stated that the much-awaited upgrade contains two significant improvements that will make building apps on the blockchain much easier.
*After trading at highs of $0.1166 in middle August, Stellar (XLM) dropped in price and entered a consolidation bout subsequently
*At the time of writing, XLM/USD is changing hands at $0.1924, having gained 50.94% in the past 24 hours and 101.23% on a week-to-week basis
*On November 23, Stellar developers upgraded the network to Protocol 15
Key Levels
Resistance Levels: $0.2700, $0.2200, $0.2000
Support levels: $0.1500, $0.1350, $0.1200
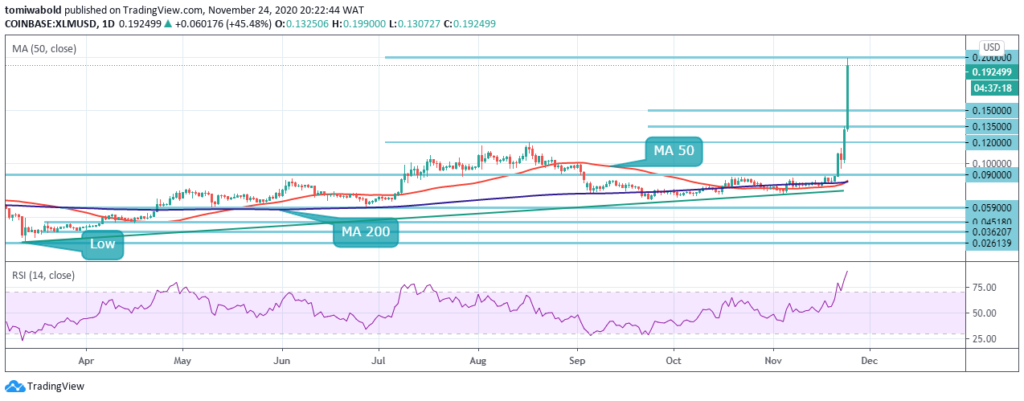 XLM/USD Daily Chart
A breakout is seen on XLM/USD daily chart to highs of $0.1990. XLM had earlier entered into a consolidation after the 43% slump from the mid-August peak of $0.1166. On November 20, XLM rose above the barrier cap at $0.0900 as the bulls capitalized on the move to begin afresh uptrend to new highs. A breach past $0.20 resistance and $0.25 might start a new journey towards XLM all-time highs at just above $0.60.
On the flip side, if the pair turns down from the current levels, the initial support is created by $0.15 resistance turned support which may serve as a backstop for the downside move. If this caves in, the sell-off is likely to gain traction with the next focus on $0.12 that stalled August’s recovery. A sustainable move below this level will invalidate the bullish outlook and bring the MA 200 and MA 50 support at $0.0845 into focus.
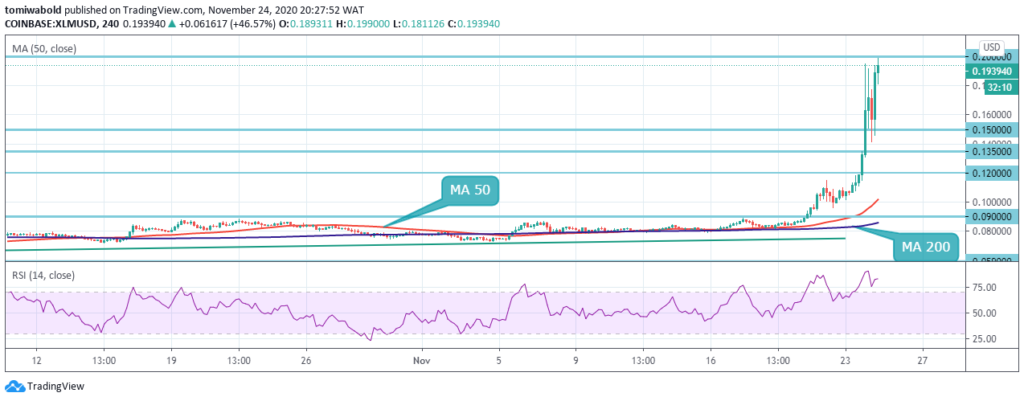 XLM/USD 4-Hour Chart
As seen on the 4-hour chart, after setting a new multiyear high, XLM bumped into resistance on its way to $0.20. A breach past $0.20 is necessary to sustain XLM’s upward advance. However, Stellar remains mainly in the bulls’ hand considering a potential rally to $1.2. A breakout beyond the $0.2200 resistance level is currently required to increase technical buying on the XLM/USD pair.
On the flip side, an overbought RSI may signal that XLM is ready for a downside correction. If the downside starts gaining traction, Stellar will create a new bearish countdown to $0.15, $0.1350, and subsequently to MA 50 close at $0.10. Stellar may find it difficult to overcome the $0.2000 resistance level in early-week trading, further increasing the chances of a short-term technical correction.
Note: Kryptomoney.com is not a financial advisor. Do your research before investing your funds in any financial asset or presented product or event. We are not responsible for your investing results
Image Credit: Shutterstock


Keep in mind that we may receive commissions when you click our links and make purchases. However, this does not impact our reviews and comparisons. We try our best to keep things fair and balanced, in order to help you make the best choice for you.


