Tezos (XTZ), currently the 10th largest digital asset with a total market value of $1.2 billion, has risen more than 9.72 percent in the last 24 hours as seen on Coinmarketcap to trade at $1.7449 at the time of writing. Tezos’ short-term rebound is moving in line with other top-20 cryptocurrencies after they made a fast bounce in tandem with equity indices, while the U.S. Senate is still debating the 4 Trillion stimulus package in favor of American businesses. The Tezos Foundation recently announced it will explore the resolution of lawsuits for the pending class-action cases due to increasing legal costs. The cases concern if Tezos crypto (XTZ) is a security and if it’s running a legitimate ICO or misleading its investors.
*XTZ/USD short-term recovery moves in line with other top 20 currencies
*Tezos rally progresses, surpassing the 1.7500 level
*The Tezos Foundation announced the decision to explore all pending lawsuits
Key Levels
Resistance Levels: $2.50, $2.00, $1.85
Support Levels: $1.54, $1.45, $1.20
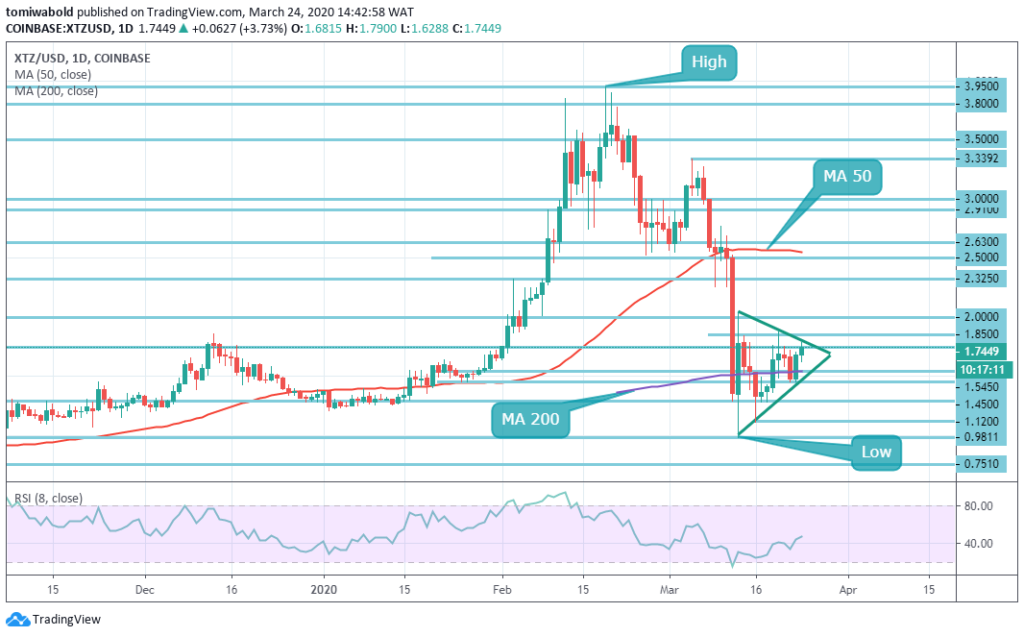 XTZ/USD rebounded at a price level of $1.4500 during the prior session and managed to recover ground past $1.5450 level. The upside momentum continued, however, as Tezos rally progressed, it broke past the level of $1.7500. A sustainable push beyond that region would open the way to a price of $1.8500 level. This psychological level is compounded by the narrowing triangle of the medium-term where a breakdown is imminent.
Besides, this region acted as the lower boundary of the previous consolidation route. The $1.8500 level is followed by the $2.000 level of resistance. On the downside, a sustained fall under the $1.6288 level intraday low may accelerate downside pressure and drive the price toward the crucial $1.4500 and $1.2000 level.
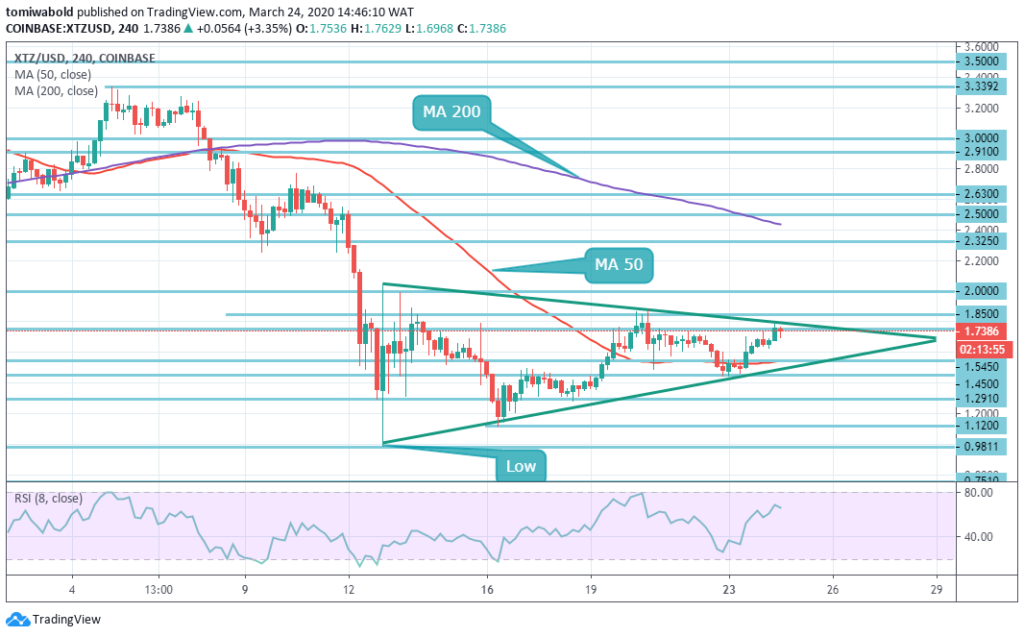 Actively Tezos is in a complete consolidation phase. The price kept highs higher but it also kept highs lower and this means it converges to an endpoint of the triangle pattern shown in the above chart. As of the present, the price is still looking pretty bullish for the last three 4-hour candles.
As for the indicators, the RSI has gone higher than the mid-line of 50. This is probably a positive sign but there is currently no sign of shifting into overbought. Unless the bulls can keep the XTZ/USD pair past $1.8500 level, where the bullish setup is completed. This trend has a target price level of $2.000.
Note: Kryptomoney.com is not a financial advisor. Do your research before investing your funds in any financial asset or presented product or event. We are not responsible for your investing results
Image Credit: Shutterstock


Keep in mind that we may receive commissions when you click our links and make purchases. However, this does not impact our reviews and comparisons. We try our best to keep things fair and balanced, in order to help you make the best choice for you.


