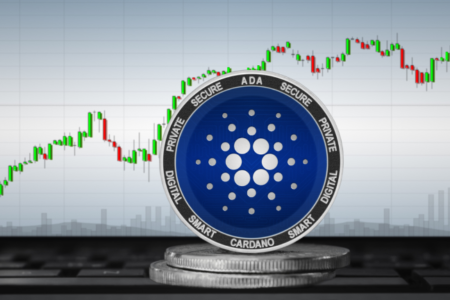
Cardano has persisted to surpass most of the market’s major cryptos. In addition to the price spike beyond $0.094, the market cap of ADA has also risen exponentially to the point of replacing Tezos (XTZ) from the tenth position. ADA/USD is losing value at $0.0759 at the time of writing, down over 7 percent over the last 24 hours. The coin is already almost 70 percent on a month-on-month basis, notwithstanding the sell-off. Upon garnering $310 million in transaction volume, Cardano now has a market cap of approx $2.0 billion. Its biggest competitor, Tezos, now ranks 11th with a $1.9 billion market value. As per Google Trends, the search interest for ADA is at the maximum level since January combined with a spike in its on-chain activity as stakeholders become ready for the Shelly upgrade. As per IntoTheBlock data, the number of ADA addresses reached a peak of 385.080 on June 6. It also emerged that ADA worth $7 billion had been transferred by large-scale holders as of late May.
*ADA/USD is losing value at $0.0759 at the time of writing, down over 7 percent over the last 24 hours
*The coin is already almost 70 percent on a month-on-month basis, notwithstanding the sell-off
*As per Google Trends, the search interest for ADA is at the maximum level since January combined with a spike in its on-chain activity as stakeholders become ready for the Shelly upgrade
Key Levels
Resistance Levels: $0.0100, $0.0936, $0.0880
Support Levels: $0.0728, $0.0657, $0.0550
 ADA/USD Daily Chart
After a good run, Cardano (ADA) recorded profit-taking. The crypto had pulled back to the daily retracement level of $0.0728. Also beneath this zone is the MA 50 at ($0.0589). Therefore bulls are likely to be vigorously defending this zone. Once price shifts down and the level rebounds well before MA 50, the bulls may attempt to propel it beyond $0.0936.
Once sustained, the upswing is probable to continue with the target, at $0.1000. Alternatively, once the bears plunge the ADA/USD pair beneath the horizontal support at $0.0657, breaching the MA 50 at ($0.0589) marking a drop to the retracement level of 50 percent. A violation beneath this support implies a weakened momentum.
 ADA/USD 4-Hour Chart
On the intraday charts, ADA/USD plunged to around $0.0850 beneath 4-hour MA 50 while moving under $0.0800 and $0.0761 while downward reinforcement may step in at 4-hour MA 200 later. It is swiftly followed by $0.0728, which is the highest level in 2020 before. This region is expected to halt downside correction and serve as a launchpad for upside activity to proceed.
On the positive, once $0.0850 is out of the path, ADA/USD may be increasing the rebound to $0.0900 which prevented the bulls early in June. The RSI stays close to the oversold territory on the 4-hour chart and gives evidence of a reversal. At these levels, traders may further look for a rebound.
Note: Kryptomoney.com is not a financial advisor. Do your research before investing your funds in any financial asset or presented product or event. We are not responsible for your investing results
Image Credit: Shutterstock
Keep in mind that we may receive commissions when you click our links and make purchases. However, this does not impact our reviews and comparisons. We try our best to keep things fair and balanced, in order to help you make the best choice for you.