
The price of Bitcoin is regaining upside traction, displaying strength, and climbing quite comfortably after recording weakness during its corrective phase. BTC price had plunged beneath $11,200 to $10,000 zone a few days back. After trading range-bound, Bitcoin (BTC) went up from a low of $10,192 to register an intraday high of $10,737 as dip buyers propel BTC/USD beyond $10,700. The Bitcoin (BTC) market cap is currently $197.56 billion, with $48.89 billion traded in the past 24 hours. Bitcoin is exchanging hands at $10,623 at press time and it’s up by 4.24% on the day. Bitcoin has maintained an inverse correlation with the U.S. Dollar Currency Index (DXY). However, the anticipated Dollar index correction is presently boosting the Bitcoin bull case as the USD confronts a potential resistance level with a pullback most likely. Bitcoin and other assets might see a relief rally if the USD corrects.
*BTC price had plunged beneath $11,200 to $10,000 a few days back
*After trading range-bound, Bitcoin (BTC) went up from a low of $10,192 to register an intraday high of $10,737 as dip buyers propel BTC/USD beyond $10,700
*Anticipated Dollar index correction is presently boosting the Bitcoin bull case as USD confronts a potential resistance level with a pullback most likely
Key Levels
Resistance Levels: $11,500, $11,200, $11,000
Support Levels: $10,200, $10,000, $9,800
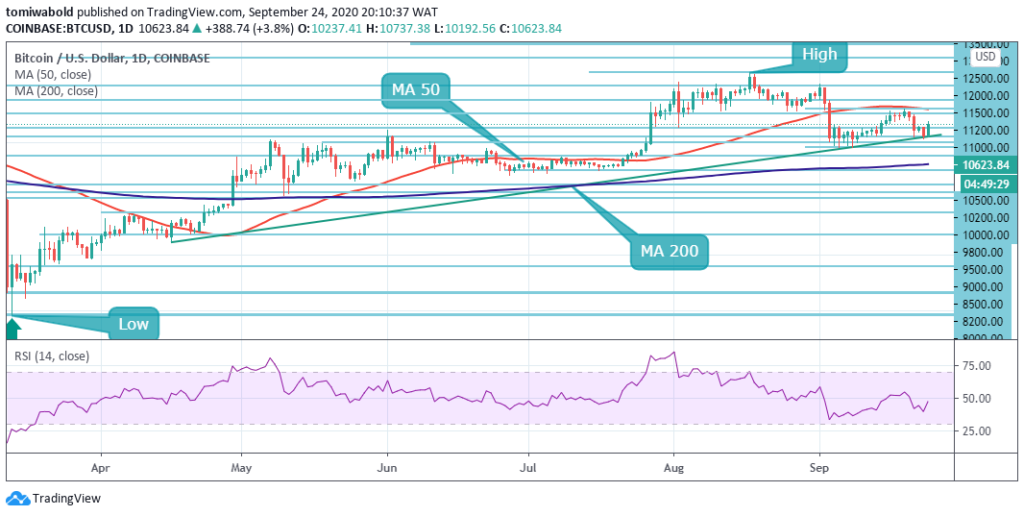 BTC/USD Daily Chart
Bitcoin price is now trading past the key $10,500 range, after falling from the 2020 high of $12,486 to register a monthly low around the $9,800 zone. On the daily time frame, Bitcoin has also set a higher low before pushing past $10,500. A higher low in the prior day that retested Bitcoin’s bear market bottom at $10,135 of the ascending trendline support has kept the hope of an uptrend intact.
A higher low, however, is dangerous, and if daily time frame trends turn down, the price may approach the recent low to breach the $10,000 support. And going by the definition of a downtrend alone, and what a bullish market structure should look like, the crypto asset could be in for another surprise collapse in the days ahead.
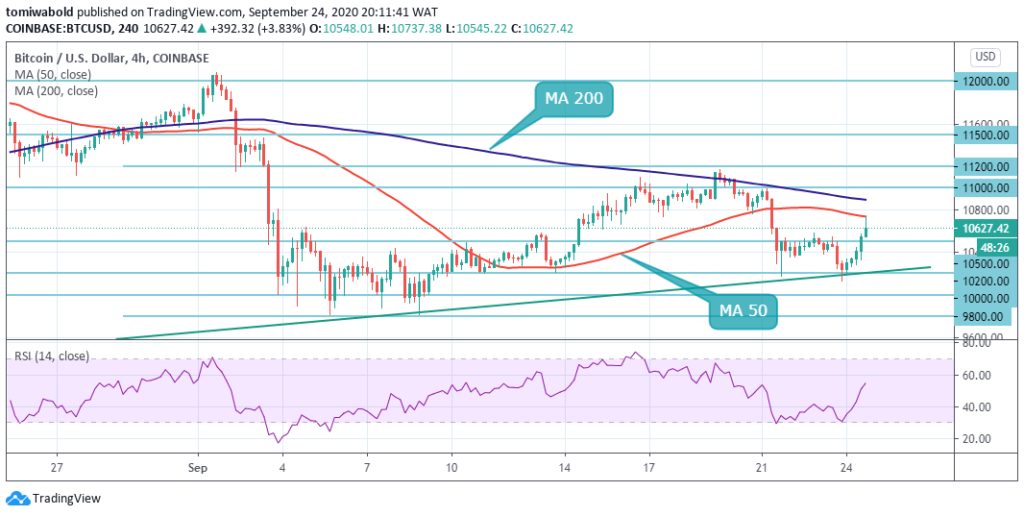 BTC/USD 4-Hour Chart
As seen on the 4-hour time frame, Bitcoin has fallen to a fresh weekly trading low at $10,135 in the prior day where it rebounded. Following another day of technical correction in the Dollar index, BTC/USD regained upside traction. The USD technical buying was also a factor in the recent BTC decline, where the price was rejected beneath the horizontal support turned resistance at $11,200.
BTC/USD bulls now need to defend the $10,500 key level to encourage a rally back towards the $11,000 resistance area. The 4-hour price has broken beyond the $10,500 and 4 hour MA 50 resistance levels in the present session. The BTC/USD pair is only bullish while trading above the $10,500 level, key resistance is found at the $11,000 and the $11,500 levels. If the BTC/USD pair trades below the $10,500 level, sellers may test the $10,200 and $9,800 levels.
Note: Kryptomoney.com is not a financial advisor. Do your research before investing your funds in any financial asset or presented product or event. We are not responsible for your investing results
Image Credit: Shutterstock


Keep in mind that we may receive commissions when you click our links and make purchases. However, this does not impact our reviews and comparisons. We try our best to keep things fair and balanced, in order to help you make the best choice for you.
