
The cryptomarket terrain stays mixed with a variant of red and green. Sluggish price action encroached the market corners with BTC trading beneath $18,500. On November 24, Polkadot (DOT) traded at highs of $6.45, price failed to hold at this level as rejection ensued. In a subsequent relief rally, DOT traded back at $5.83 after which it took another leg down. Polkadot is still trading down at the time of writing as bulls seek to buy DOT/USD dip. Polkadot (DOT) is exchanging hands at $4.85 down by 1.51% daily and 12.08% on a 7-day basis. The market cap is ranked 9th on the Coinmarketcap table and currently stands at $4.27 billion with $390 million in trade volume over the past 24 hours. Polkadot’s DEX platform, Polkastarter release is slated for December 15, as said in a Polkadot announcement. The DEX platform aims to provide projects in the DeFi sector with a means to raise funds. This release may cause DOT price to gain some ground, as more investors are paying attention to the development.
*Polkadot is exchanging hands at $4.78 down by 1.51% daily and 12.08% on a 7-day basis
*Polkadot is still trading down at the time of writing as bulls seek to buy DOT/USD dip
*Polkadot’s DEX platform, Polkastarter release is slated for December 15
Key Levels
Resistance Levels: $6.90, $6.00, $5.20
Support Levels: $4.50, $4.00, $3.54
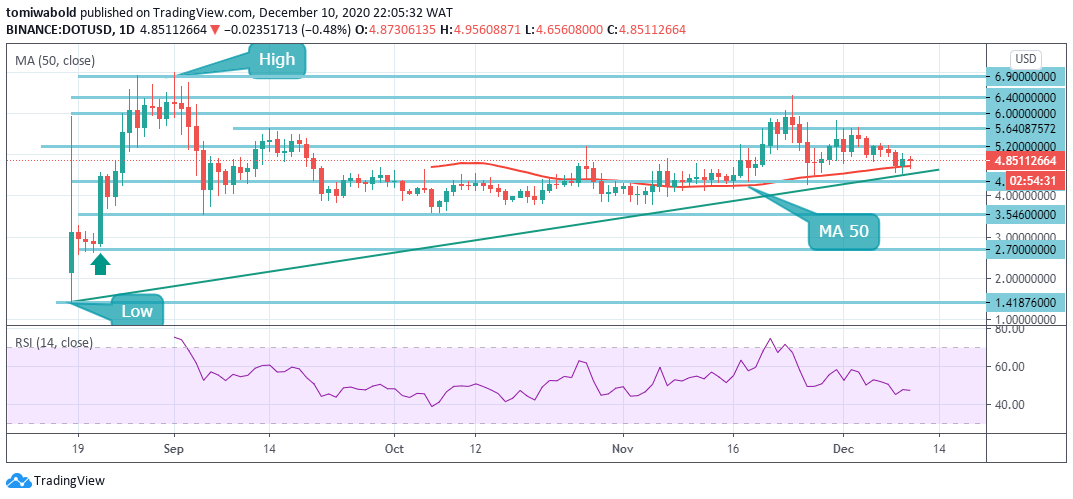 DOT/USD Daily Chart
Intense selling pressure on Polkadot (DOT) pulled the price slightly below the daily MA 50 at $4.7. A mild rebound occurred but the bulls’ attempt to push the price beyond $5 was met with resistance. Polkadot bulls must now seek to flip this crucial level into support before the uptrend can resume. Once this mission is successful, the pair will make one more attempt to rise above the $5.64 barrier and then $6.0.
On the flip side, the bears are unlikely to give up their advantage easily. They will try to defend the $5 resistance level. In the event of a rejection, it may increase the possibility of a break below the MA 50 at $4.7. The bulls are most likely to buy the dip at $4.5 which coincides with the ascending trendline support. Further declines may cause the DOT/USD pair to retest the $4.0 marks to $3.54 support range.
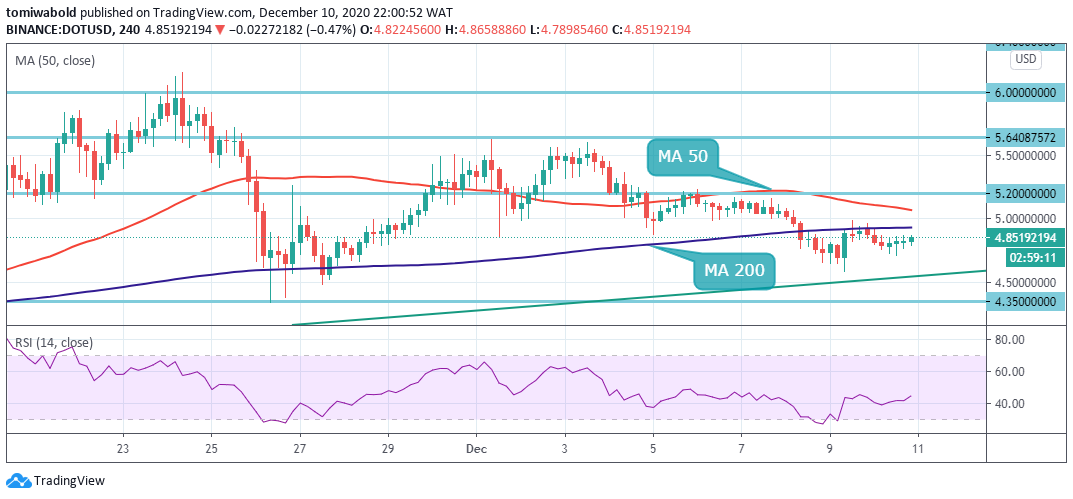 DOT/USD 4-Hour Chart
The hunt for higher support continues on DOT/USD after its loss of the 4 hour MA 50 and MA 200 support levels. Massive sell orders may be triggered if Polkadot (DOT) slides beneath $4.70. Further down, support is envisaged first at $4.5 and then $4.35. On the flip side, an increase in demand for DOT may cause a bullish reversal to come into the picture.
In this case, a rebound may occur past the MA 200 at $4.92 and then $5.08 coinciding with the MA 50 close. The DOT/USD pair is only bullish above $5.20. The main resistance is found at the $5.64 and $6.0 level. As long as DOT/USD pair trades beneath $5.0 marks, the $4.50 to $3.54 support zone levels may be tested by sellers.
Note: Kryptomoney.com is not a financial advisor. Do your research before investing your funds in any financial asset or presented product or event. We are not responsible for your investing results
Image Credit: Shutterstock


Keep in mind that we may receive commissions when you click our links and make purchases. However, this does not impact our reviews and comparisons. We try our best to keep things fair and balanced, in order to help you make the best choice for you.

