
The dust appears to have settled in the crypto market following the bulls’ rush to defend key support levels. Most crypto assets are following in BTC’s footsteps as seen in a rebound in the market corners. Ethereum price has correlated with BTC recently. On Dec. 1st, ETH set a new 2020 high of $636. Multiple rejections are seen from this level to date have sent Ethereum price to where it trades. However, buyer congestion at $530 prevented further declines as dip-buying continues on ETH/USD. At the time of writing, ETH is exchanging at $565, up by 2.08% on the day. Ethereum is currently second on the Coinmarketcap table, with a market cap of $63.40 billion and $8.41 billion in trade volume over the past 24 hours. Ethereum flips BTC in developer activity, as stated in the 2020 developer report from Electric Capital. Nearly 2,300 average monthly developers worked on Ethereum across Q3 of 2020, while Bitcoin ranks second closely below 400.
*Buyer congestion at $530 prevented Ethereum from further declines
*At the time of writing, ETH is exchanging at $565, up by 2.08% on the day
*Ethereum flips Bitcoin in developer activity, as stated in 2020 developer report from Electric Capital
Key Levels
Resistance Levels: $700, $650, $600
Support Levels: $530, $488, $450
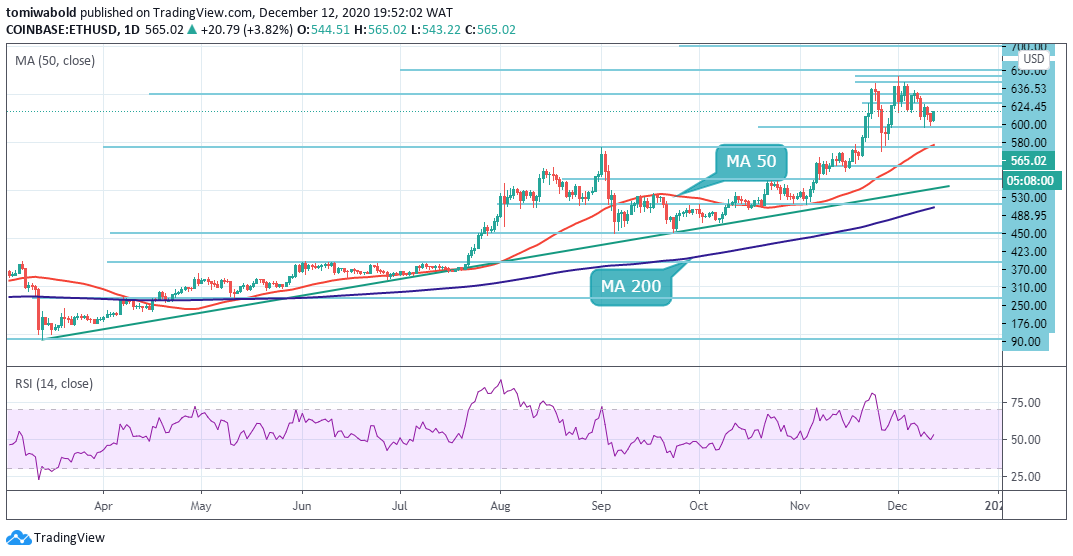 ETH/USD Daily Chart
A rebound is seen on the ETH/USD daily chart from the prior day’s low of $530 to an intraday high of $565. Barring an extended crypto rally, the first major resistance level at $580 would likely cap any upside. The second major resistance level sits above $580. If the price turns up from these levels and breaks above the $600 barrier, the bulls will then try to push the price past $624 and beyond.
On the flip side, the bears are presently attempting to sustain the price below its price of $565. If they succeed, a buyer congestion zone is seen between $530 and $535 which acted as a backstop previously. in a further, sell-off, the ETH/USD pair could retest the MA 50 close at $491 and then late November lows of $488 where the bulls may come into play.
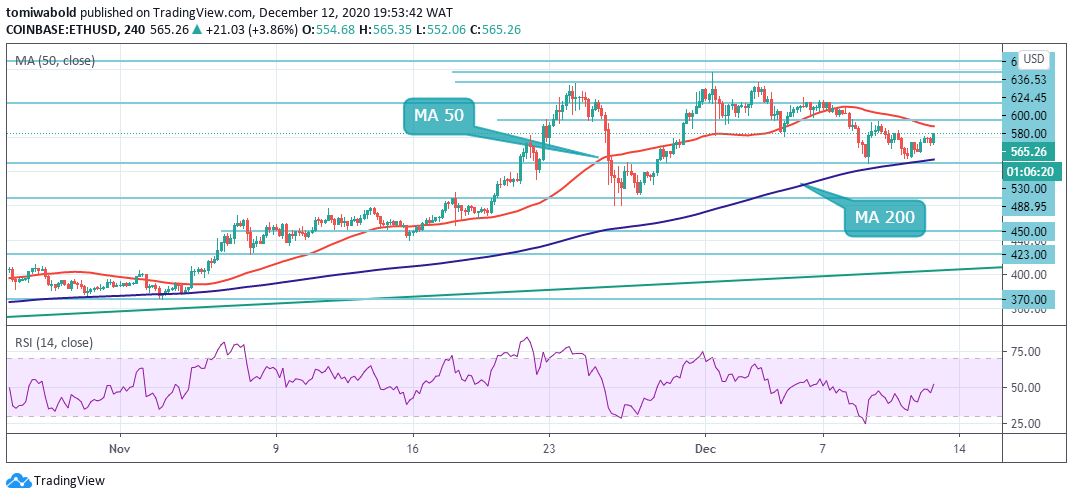 ETH/USD 4-Hour Chart
ETH is depending on the ability of the 4 hour MA 200 to hold, having lost the MA 50 support. If the support at the MA 200 at $532 fails, ETH decline might stretch as far as $488. The RSI move beyond its midpoint suggests an overthrow of the bears by the bulls. On the flip side, the resistance cap at the MA 50 might limit further ETH price action causing delay to the bulls.
A breakout above the MA 50 close at $576 could catapult Ethereum past key hurdles at $580 and $600.The ETH/USD pair is only bullish while trading beyond the $530 level around the MA 200, key resistance is found at the $580 and the $600 levels. If the ETH/USD pair trades beneath the $530, sellers may test the $488 and $450 prior support cluster.
Note: Kryptomoney.com is not a financial advisor. Do your research before investing your funds in any financial asset or presented product or event. We are not responsible for your investing results
Image Credit: Shutterstock


Keep in mind that we may receive commissions when you click our links and make purchases. However, this does not impact our reviews and comparisons. We try our best to keep things fair and balanced, in order to help you make the best choice for you.


