As the world expects the United States to complete the ongoing vote-counting session. The IOTA token has spotted another slight boost. It has been in a downtrend charting consecutive bearish days before a bounce back from support push IOTA/USD beyond the $0.2650 barrier. IOTA resumed the uptrend after the downtrend lost momentum at $0.2146. An ongoing recovery pulled the token to register an intraday high at $0.2773. IOTA’s total market cap now stands at $746 million with a trading volume of $14.41 million in the past 24 hours. At the time of writing, IOTA is doddering at $0.261 amid a growing momentum. IOTA gained 16.71% in the past 24 hours and 5.50% on a week to week basis. IOTA nears a total decentralization quest in the form of IOTA 2.0. sharing impressive data and progress. Recently, the IOTA Foundation announced the final Alpha release for IOTA Streams, an open-sourced DLT protocol that will enable encrypted and decentralized data streaming.
*It has been in a downtrend charting consecutive bearish days before a bounce back from support push IOTA/USD beyond the $0.2650 barrier
*At the time of writing, IOTA is doddering at $0.261 amid a growing momentum
*IOTA nears total decentralization quest in the form of IOTA 2.0. sharing impressive data and progress
Key Levels
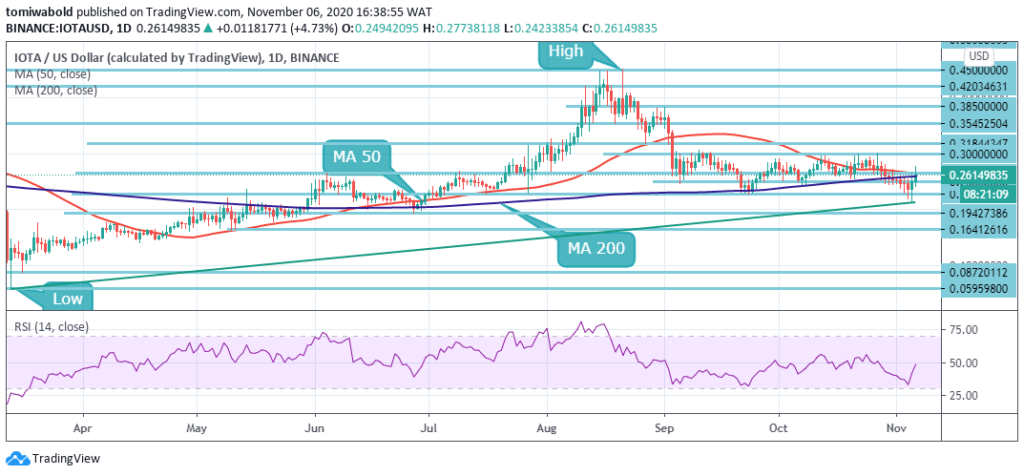
Resistance Levels: $0.385, $0.354, $0.300
Support Levels: $0.250, $0.228, $0.194
 IOTA/USD Daily Chart
On the daily chart, IOTA is nurturing an uptrend from a recently established support at $0.2146. After a price rejection at $0.3, IOTA bulls attempted to hold a price above $0.2650 but met with futility. A rebound from the ascending trendline support initiated a recovery amid rising buying pressure. At the moment, IOTA is changing hands above the MA 50 and MA 200 giving credibility to the bullish optimism.
A sustained break above the MA 50 which acted as a cap for price action will allow buyers to shift the focus back to $0.30 and then $0.4. The Relative Strength Index also reinforces the bulls’ presence after bouncing off the oversold region. On the downside, a push below the MA 50 coinciding with $0.25 might prompt a revisit to the $0.2146 support.
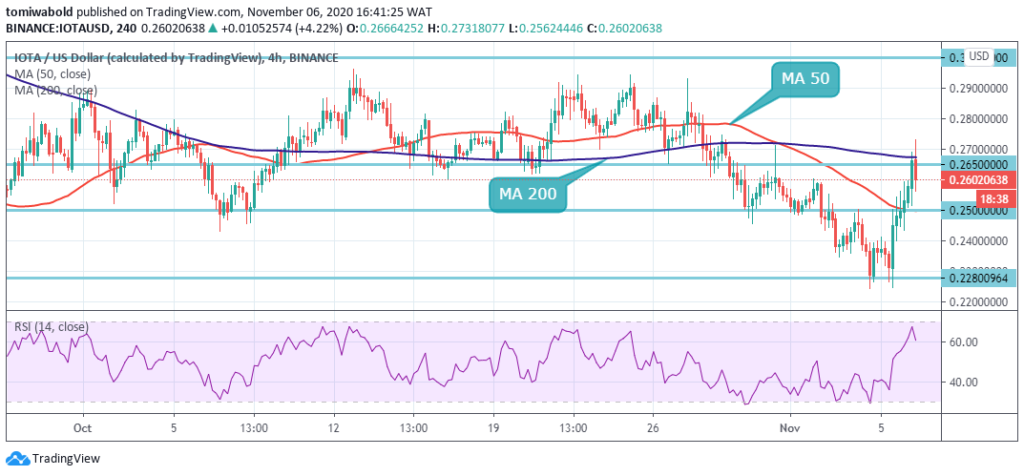
 IOTA/USD 4-Hour Chart
As seen on the 4-hour chart, IOTA’s bulls are working around the clock to sustain the fresh uptrend above the MA 50. A sustained breach past the $0.265 level will target the resistance at $0.30. On the flip side, if IOTA fails to hold above the MA 200, a rejection might spur a revisit to the primary support at $0.228.
If bears regain control over the price, declines to $0.20 may come into the picture. The IOT/USD pair is only bullish while trading above the $0.265 level, key resistance is found at the $0.300 and the $0.354 levels. If the IOT/USD pair trades below the $0.265 level, sellers may test the $0.250 and $0.228 levels.
Note: Kryptomoney.com is not a financial advisor. Do your research before investing your funds in any financial asset or presented product or event. We are not responsible for your investing results
Image Credit: Shutterstock
Keep in mind that we may receive commissions when you click our links and make purchases. However, this does not impact our reviews and comparisons. We try our best to keep things fair and balanced, in order to help you make the best choice for you.