
Litecoin (LTC) is one of the 10 leading digital currencies and has been closely following Bitcoin ever since creation. Today’s Litecoin price is $44.92, with a trading volume of $1,818,673,279 within 24 hours. During the recent day, the LTC price has risen by 0.22 percent. It has a circulating supply of around 65 Million coins and a maximum supply of 84 Million coins. Despite its recent plunge LTC/USD flips bullish with a low trading activity to $45.00. Litecoin (LTC) drifted from the intraday high at $44.95 and moved back by press time to the day’s low of $44.27. In a recent tweet, Litecoin founder Charlie Lee confirmed the release of the Litecoin Core 0.18.1. The remarkable protocol adjustments touch on aspects such as mining and configuration options. After that, Litecoin Core 0.20 will be launched, which will bring subscribers into sync with the new Bitcoin Core.
*Despite its recent plunge LTC/USD flips bullish with a low trading activity to $45.00
*Litecoin (LTC) drifted from the intraday high at $44.95 and moved back by press time to the day’s low of $44.27
*In a recent tweet, Litecoin founder Charlie Lee confirmed the release of the Litecoin Core 0.18.1
Key Levels
Resistance Levels: $55.00, $50.00, $45.00
Support Levels: $43.00, $39.50, $33.00
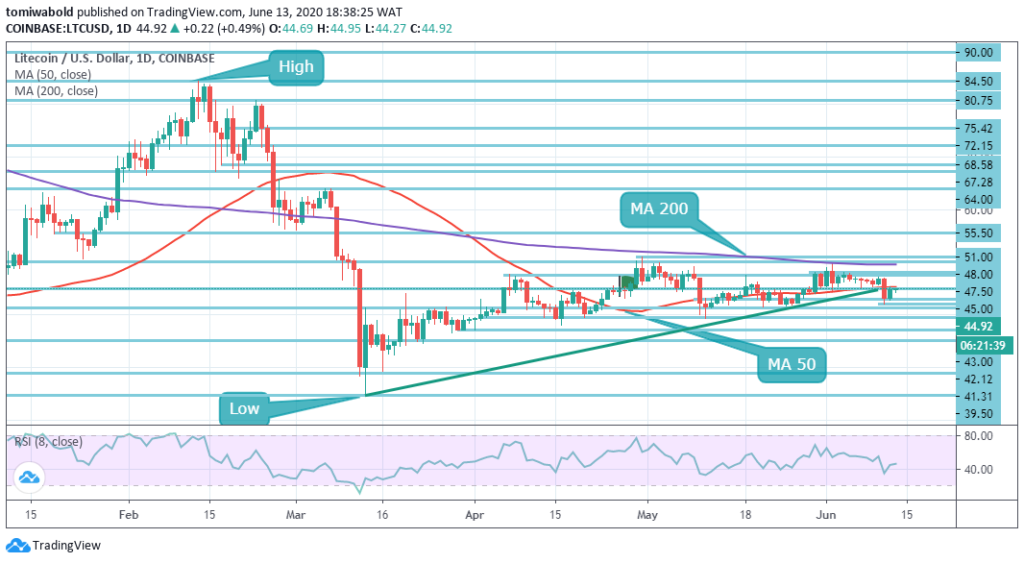 LTC/USD Daily Chart
The MA 50 and MA 200 hold beyond the price at $45.00 while being horizontally positioned on the daily chart for the LTC/USD market, reinforcing the prior sideways trading trend after a brief period of bear market conditions. The MA 50 now stands at $45 above the current price level, but may serve as short-term resistance. Likewise, there are presently no visible bullish or bearish divergences on RSI or volume.
Nonetheless, once the bulls are resisted from the level of $45.00, in the coming hours we may see more bearish activity. The RSI is not over-sold and has only marginally bounced, which implies that bears may attempt the downside as long as LTC/USD is unable to break the horizontal resistance of $45 and MA 50 upwards.
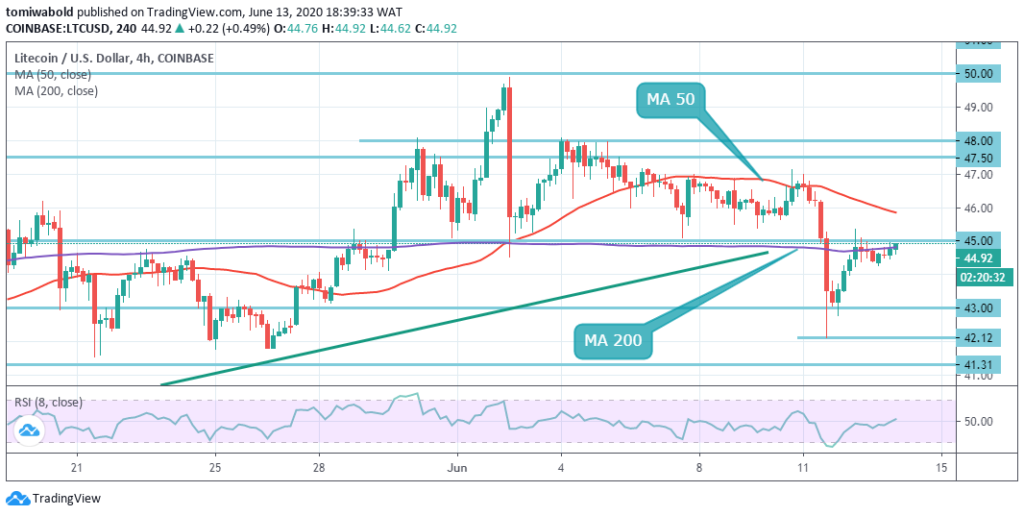 LTC/USD 4-Hour Chart
Litecoin (LTC) broke beneath the moving averages on the intraday chart and declined toward initial support at $42.12 on June 11. The bulls have ended up buying the dip and are presently attempting to shove the price back beyond the moving averages. LTC/USD is supported by the region of $43.00-$42.12 which involves such technical support as the $41.31 horizontal line.
Litecoin is presently fighting to stay beyond the $44.92 at 4-hour MA 200, but may still have to confront the $45.80 at MA 50 ahead. It will be challenging for the bulls to establish a 4-hour bull run, as they need to match a clear higher low than $42.12 and then a higher high. Once positive, CoinMarketCap’s seventh-ranked crypto-currency may aim for the $50 level.
Note: Kryptomoney.com is not a financial advisor. Do your research before investing your funds in any financial asset or presented product or event. We are not responsible for your investing results
Image Credit: Shutterstock


Keep in mind that we may receive commissions when you click our links and make purchases. However, this does not impact our reviews and comparisons. We try our best to keep things fair and balanced, in order to help you make the best choice for you.
