
Tron’s native token TRX was among the top gainers on Tuesday as its price surged up to 11 percent making it one of the best-performing digital assets. The token has been on an upward spiral for the 3rd consecutive day. The crypto asset extended its bearish leg in the prior week to $0.027 low after its correction from $0.053 high. As the process of consolidation proceeds in the market, bulls defend price on TRX/USD to $0.036 intraday high. With a market capitalization of around $2.37 billion, Tron sits amongst the top 20 digital assets and has firmly established the 13th position on the Coinmarketcap table. At the time of writing, TRX is changing hands at $0.034. Tron based DeFi developments may benefit TRX as developers of the network and Tron Foundation has been pushing the DeFi narrative heavily over recent days. There are now several Tron-based DeFi protocols that mimic those seen on Ethereum.
*The crypto asset extended its bearish leg in the prior week to $0.0271 low after its correction from $0.0533 high
*As the process of consolidation proceeds in the market, bulls defend price on TRX/USD to $0.036 intraday high
*Tron based Defi developments may benefit TRX as developers of the network and Tron Foundation has been pushing the DeFi narrative
Key Levels
Resistance Levels: $0.046, $0.040, $0.037
Support Levels: $0.033, $0.030, $0.027
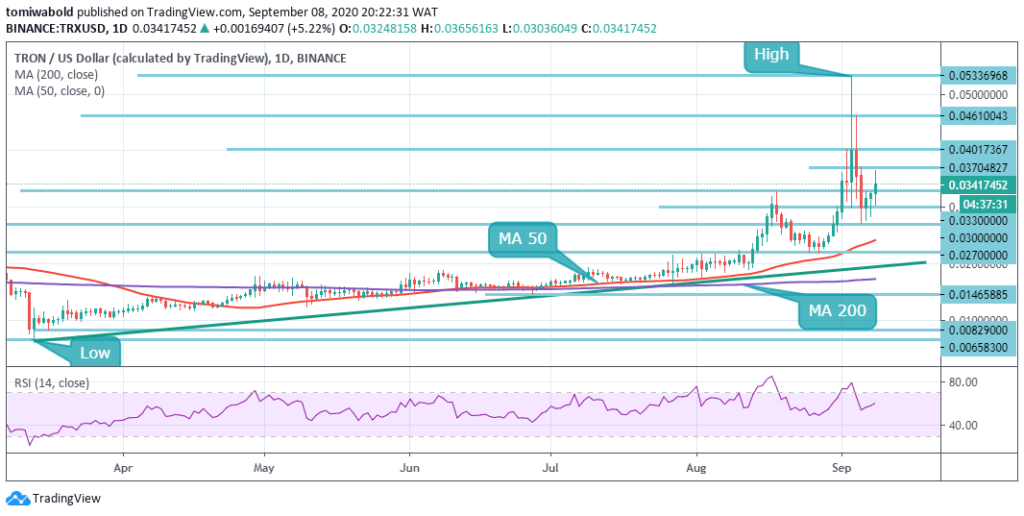 TRX/USD Daily Chart
On the daily chart, TRX moves within the upside channel with the local resistance at $0.037. Once it is out of the way, the upside will gain traction with the next focus on the psychological $0.040 and $0.046 levels. Apart from that, the daily RSI points upward, and it has not reached an overbought territory yet, which is a positive signal in the near term.
The TRX/USD pair is currently trading at the price level of $0.034 and enjoys the price congestion support around the horizontal line at $0.033 that has built up over the past 3 days. There is excellent support at the $0.027 level, which could contain the decline in the TRX/USD price. The upside may gain traction to the $0.040 region once the intraday high of $0.036 is cleared.
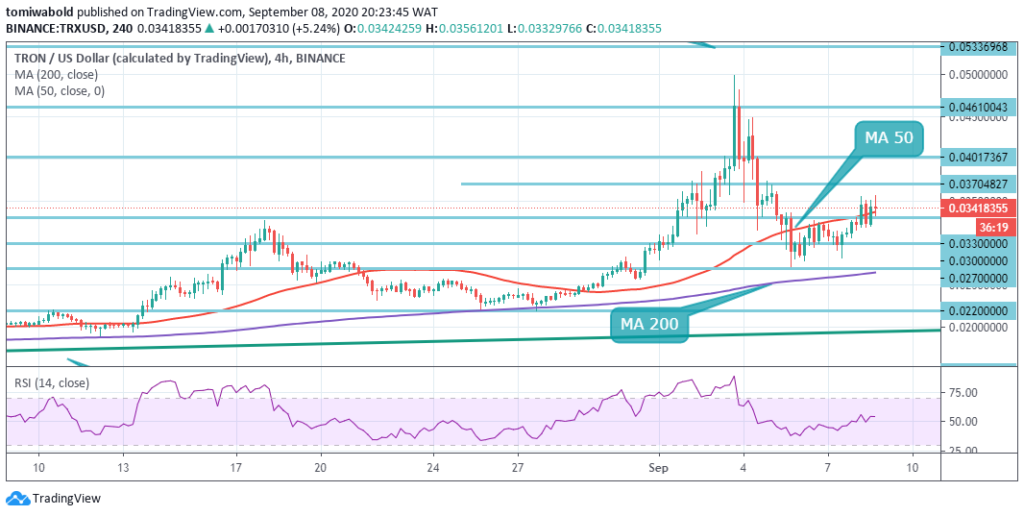 TRX/USD 4-Hour Chart
As observed on the 4-hour time frame, TRX/USD is well-positioned for further growth with the initial advance past the 4 hour MA 50 around $0.033. However, considering the state of the RSI trading marginally beyond its midlines, the price may be vulnerable to the downside correction. A move below $0.033 area will cancel the bullish scenario.
Lower time frame analysis shows that bulls may test towards the $0.040 area if they can anchor the price above the $0.037 resistance zone. The TRX/USD pair is only bullish while trading above the $0.033 level, key resistance is found at the $0.037and the $0.040 levels. If the TRX/USD pair trades below the $0.033 level, sellers may test the $0.030 and $0.027 levels.
Note: Kryptomoney.com is not a financial advisor. Do your research before investing your funds in any financial asset or presented product or event. We are not responsible for your investing results
Image Credit: Shutterstock


Keep in mind that we may receive commissions when you click our links and make purchases. However, this does not impact our reviews and comparisons. We try our best to keep things fair and balanced, in order to help you make the best choice for you.
