
For the cryptocurrency markets, the week was rough as it’s limited to narrow ranges. Bitcoin’s advance was around $9,500 on the upside and $8,900 on the downside within the trading range confined by bears. BTC/USD is bought massively on dips beneath $9,000 although it’s a positive technical indication. The market capitalization of Bitcoin exceeded $170 billion, whilst the average volume of trading exceeds $18 billion. More than 70 percent of Bitcoin investors make money at the existing price, and just 23.8 percent are in red. At the time of writing BTC/USD trades at $9,236 after recording an intraday high of $9,446. Bitcoin has finished on a positive note the second quarter of 2020 as the 90-day active supply of BTC hit its pre-2017 bull run level, indicating a potential bullish period in the future of the asset as reported by Stack Funds. The spike gives a clear indication of the coin holders’ sentiment trend which tends to stabilize and follow a long-term investment path.
*More than 70 percent of Bitcoin investors make money at the existing price, and just 23.8 percent are in red
*At the time of writing BTC/USD trades at $9,236 after recording an intraday high of $9,446
*Bitcoin has finished on a positive note the second quarter of 2020 as the 90-day active supply of BTC hit its pre-2017 bull run-level
Key Levels
Resistance Levels: $10,000, $9,800, $9,500
Support levels: $9,000, $8,800, $8,500
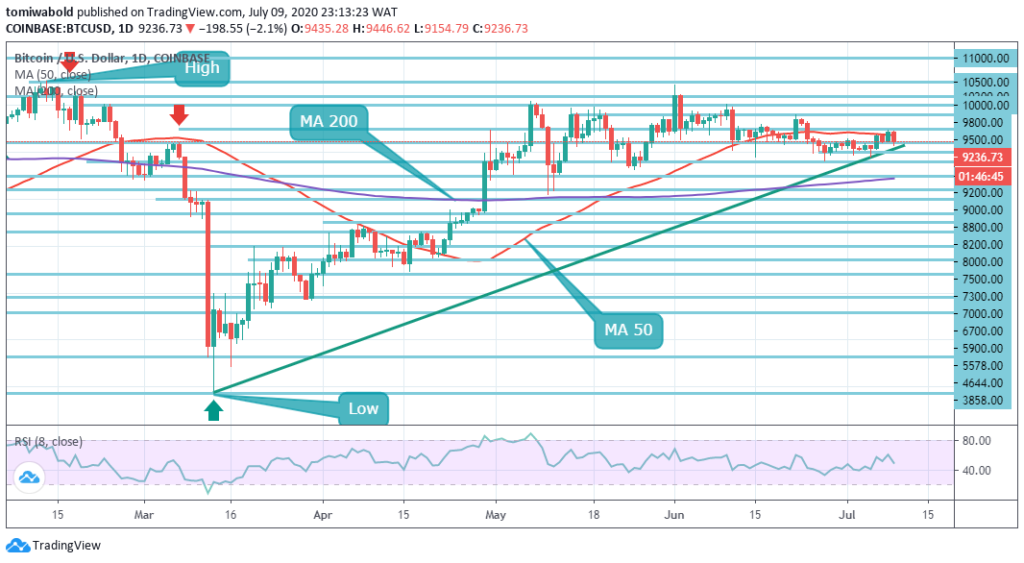 BTC/USD Daily Chart
Bitcoin tends to be more bullish in the medium to long term, as investors continue to protect the support level of $9,200 which is technically relevant. Technical analysis indicates that if the $9,500 level of resistance is breached this week, Bitcoin may rise to the $9,800 mark. This technical level has since early May acted as a buffer for Bitcoin bears.
Once bulls can keep the BTC/USD pair beyond the level of $9,800 then more advances toward the $10,500 become highly probable. The BTC/USD pair is only bullish when trading beyond the level of $9,200; the main resistance is seen at the levels of $9,500 and $9,800. Sellers may test the $9,000 and $8,800 support levels if the BTC/USD pair exchanges beneath the $9,200 level.
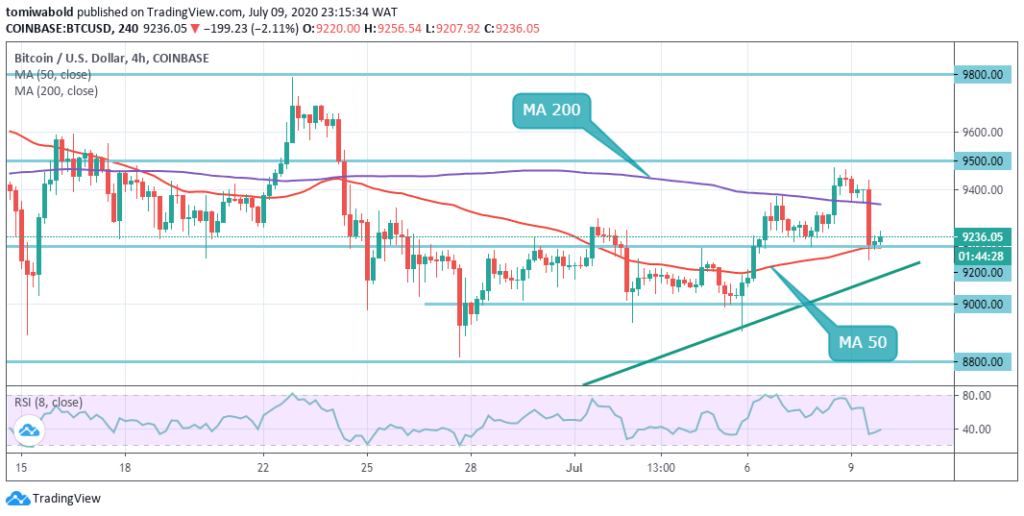 BTC/USD 4-Hour Chart
The 4-hour chart shows the range-bound existence of the activities of Bitcoin. The short-term rebound is limited at $9,500 with the MA 200 next at $9,300 positioned on approach by the horizontal resistance line. BTC/USD has held under this MA for almost two weeks now. The local support is established at $9,200 through the lower line of the MA 50 with the next emphasis on psychological $9,000 followed by the ascending trendline support.
On the positive, a continuous push beyond the current $9,500 channel resistance may help reduce the bearish momentum and boost the technical perspective in the short term. Upon this, the rebound might be adjusted to the upper side of the 4-hour chart at $9,800.
Note: Kryptomoney.com is not a financial advisor. Do your research before investing your funds in any financial asset or presented product or event. We are not responsible for your investing results
Image Credit: Shutterstock


Keep in mind that we may receive commissions when you click our links and make purchases. However, this does not impact our reviews and comparisons. We try our best to keep things fair and balanced, in order to help you make the best choice for you.


