
In the markets this week, there’s been a massive selloff across the board. After reaching a point of extreme greed, the crypto market in a flash turned to fear. It has proven to be highly challenging for the controversial Bitcoin hard fork Bitcoin Cash (BCH). After gathering pace at the upside, BCH/USD came off the highs as price holds under $230. A lack of upside traction and some bearish charting patterns is painting a grim picture for Bitcoin Cash. Bitcoin Cash (BCH) now has a $4.21 billion market capitalization, making it the 5th largest cryptocurrency. Trading volume re-asserts this position, with $2.62 billion in trades during the past 24hrs. At the time of writing, Bitcoin Cash is trading down nominally at its current price of $222, which marks a notable drop from its weekly highs of $297 and only a slight decline from its daily highs of $234. Bitcoin (BCH) Cash is en route a November fork since the latest edition of its divisive update proposal has been issued by the Bitcoin ABC team. BCHN (Bitcoin Cash Node) and Bitcoin ABC are the two factions that seek to split on the controversial Infrastructure Funding Proposal.
*At the time of writing, Bitcoin Cash is trading down nominally at its current price of $222, which marks a notable drop from its weekly highs of $297
*After gathering pace at the upside, BCH/USD came off the highs as price holds under $230
*Bitcoin (BCH) Cash is en route a November fork since the latest edition of its divisive update proposal has been issued by the Bitcoin ABC team
Key Levels
Resistance Levels: $280, $260, $245
Support Levels: $215, $200, $170
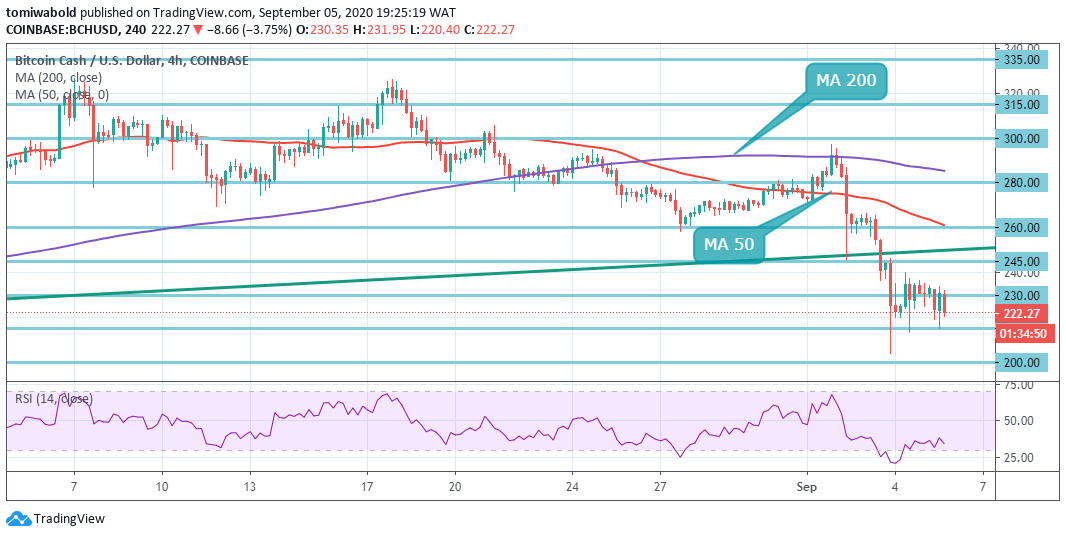
 BCH/USD Daily Chart
 Despite the pullback from the highs, bulls are gathering pace for the next push higher especially in the wake of a horizontal line at $230 upside breakout confirmed on the daily chart after the coin closed the prior day beneath the ascending trendline (pattern), located at $245. On the upside, a sustainable move above $245 is needed for the upside to gain traction.
Alternatively, a cluster of critical support at $215 and $200 should cushion the downside. The region is a critical confluence zone of support activity for the pair. A break below will expose the next support at $200, which will be put to test. Thursday’s low of $203.93 will be next on the sellers’ radar.
Short term support has been established at $215. The crypto’s immediate upside is limited by the horizontal resistance line at $245 followed by the MA 50 at $260 in the 4-hour range. The seller congestion at $215 is still intact and will most likely delay the bearish case towards $200. The Relative Strength Index (RSI) indicator tends to hover near the over-sold line. This suggests that there’s more growth potential on the market.
Overall, the bearish price pattern is projecting that the BCH/USD pair could fall towards the $200 area. The BCH/USD pair is only bullish while trading above the $245 level, key resistance is found at the $260 and the $280 levels. If the BCH/USD pair trades below the $215 level, sellers may test the $200 and lower levels.
Note: Kryptomoney.com is not a financial advisor. Do your research before investing your funds in any financial asset or presented product or event. We are not responsible for your investing results
Image Credit: Shutterstock


Keep in mind that we may receive commissions when you click our links and make purchases. However, this does not impact our reviews and comparisons. We try our best to keep things fair and balanced, in order to help you make the best choice for you.


