As investors await Bitcoin to shoot to the moon, it is already dragging prominent Altcoins such as Litecoin (LTC) along with the massive momentum. The LTC token is the best-performing Altcoin out of top-50 on a week-to-week basis. Following a remarkable recovery from March’s crash, the LTC/USD hit a peak of $69 before correcting lower. Litecoin started its fresh upward move from the $41.50 support zone against the US Dollar. The token has sustained its strong upswing as buyers eye 2 months high on LTC/USD at $64. The LTC market cap is currently 8th on the Coinmarketcap table at $3.87 billion, with $3.72 billion in exchange-traded volume over the past 24 hours. The price is now trading nicely near resistance at the $60 barrier registering an intraday high at $59.67 at the time of writing. There are now less than 18 million Litecoin to be mined, although due to the deflationary existence of the network, the last Litecoin is expected to be mined around 2142. On September 27, 2020, 1,920,000 generated the 66 millionth Litecoin at 06:01 UTC Block, indicating further achievement on the network.
*Litecoin started its fresh upward move from the $41.50 support zone against the US Dollar
*The token has sustained its strong upswing as buyers eye 2 months high on LTC/USD at $64
*There are now less than 18 million Litecoin to be mined, although due to the deflationary existence of the network, the last Litecoin is expected to be mined around 2142
Key Levels
Resistance Levels: $69, $64, $60
Support Levels: $54, $50, $45
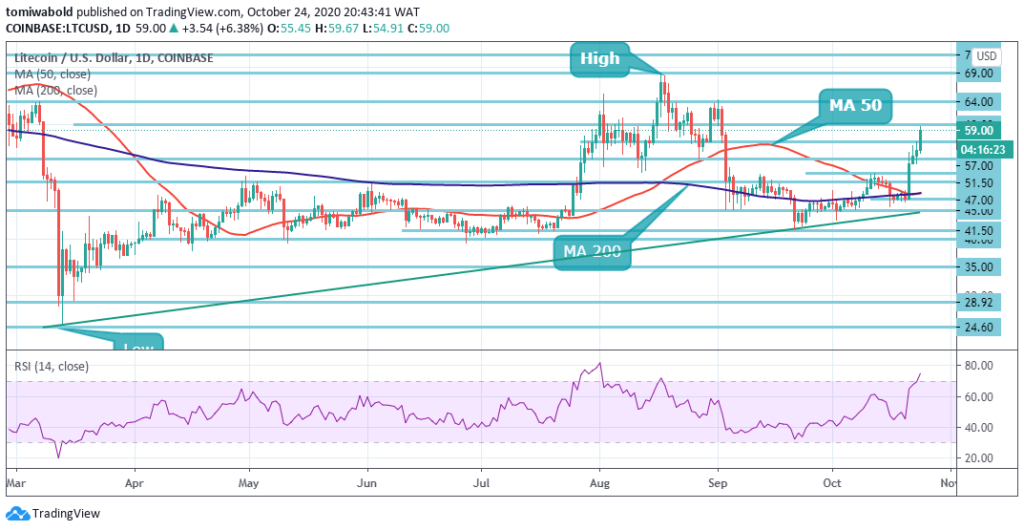 LTC/USD Daily Chart
LTC/USD positive side swing has taken its price beyond the local resistance line at $57. While it’s on the pathway higher to breach resistance at $60, the upside is capable of gaining traction with the next emphasis on $64. During the August consolidation phase, this barrier restricted the token’s rebound. A step higher may fixate on $69 (2020’s highest level) and $70.
The initial support comes at $51.50 on the downside. During the activity period of the initial 2 months, this level acted as a formidable resistance until it was breached amid the intense rally across the board. The short-term bullish situation may get nullified by a sustainable shift beneath this zone allowing a steeper decrease to $45, supported by $41.5 where potential bullish entrants might take advantage of the demand zone.
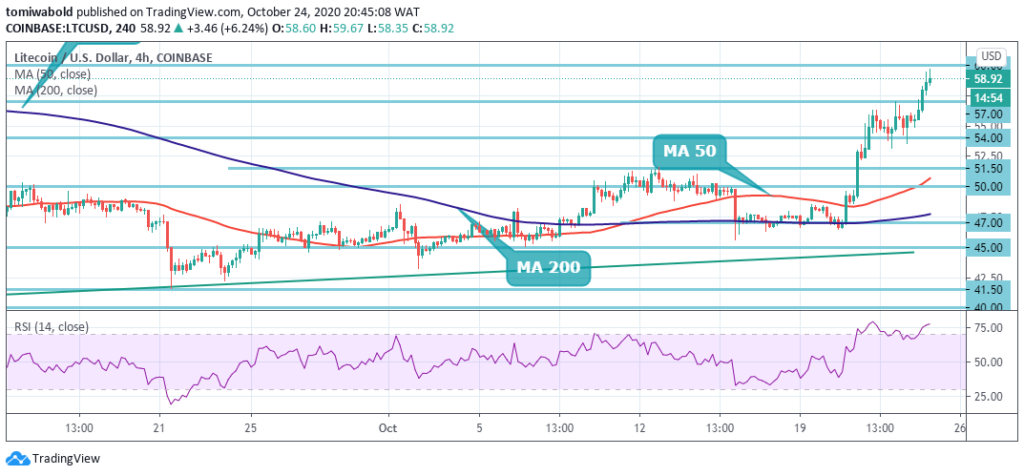 LTC/USD 4-Hour Chart
As the recent breakout beyond the 4-hour convergence zone at $54 continues to gather strength as robust support, Litecoin has surged towards the $59 area. Technical analysis suggests that for the LTC/USD pair beyond the $57 level, the $60 level offers the highest form of resistance. Failure to close beyond the $57 level may prompt the cryptocurrency to revert to the $51.50 area.
A break from the $60 resistance level, nonetheless, may be deemed a significant bullish continuation sign at the same time. Although trading beyond the $50 mark, the LTC/USD pair is only bullish; the main resistance is found at the $60 and $64 level. If the LTC/USD pair is trading beneath $50, the $47 MA 200 zone and $45 support levels can be tested by sellers.
Note: Kryptomoney.com is not a financial advisor. Do your research before investing your funds in any financial asset or presented product or event. We are not responsible for your investing results
Image Credit: Shutterstock


Keep in mind that we may receive commissions when you click our links and make purchases. However, this does not impact our reviews and comparisons. We try our best to keep things fair and balanced, in order to help you make the best choice for you.
